Today, for the first time on the Paessler blog, we'd like to introduce a guest blogger to you: Jorge de la Cruz has extensive IT knowledge, is an enthusiastic user of PRTG Network Monitor, and writes about various interesting IT topics on his Spanish blog (you should definitely pay a visit!)—now, without further ado, let's dive into NetFlow configuration and monitoring via PRTG on VMware vSphere 5.x:
Hi all, my name is Jorge de la Cruz, I'm a blogger. In this Blog entry, I will write a step-by-step guide for the configuration of NetFlow over VMware using vSphere Web Client, and also an example of VDS Virtual Distributed Switch) in my VMware lab using NetFlow.
What is NetFlow?
NetFlow is a network protocol developed by Cisco, which can be used to collect very useful information of the IP traffic. We can monitor our network traffic with it. With this flow we can also obtain a perfect picture view of our network traffic in real time. PRTG Network Monitor includes a NetFlow collector to do all the hard jobs. NetFlow is a standard in almost all network devices, not only used by Cisco; VMware, Sonicwall, Citrix, Linux and many other companies decided to include NetFlow as a network monitor technology.
Enabling NetFlow Into Our vDS
NetFlow over VMware is only available in vSphere Distributed Switches (vDS), so we will need an Enterprise Plus License to use it. We can use a Trial License of VMware vSphere for test duties and think about if our company needs it or not.
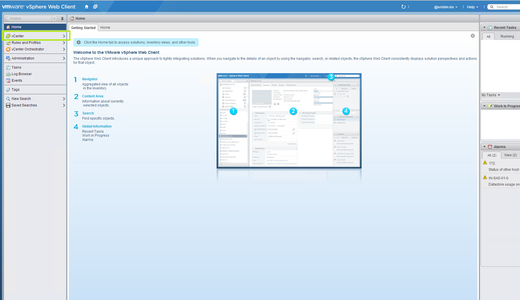
As a first step go to our vSphere Web Client > click in vCenter and then click to expand the sub-elements:
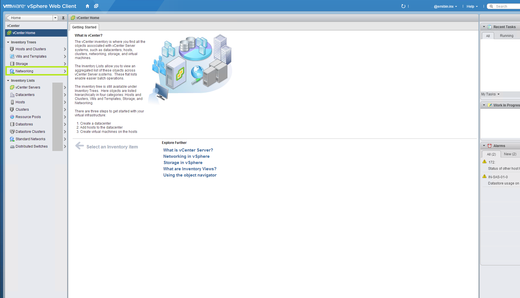
Then, click in Networking section:
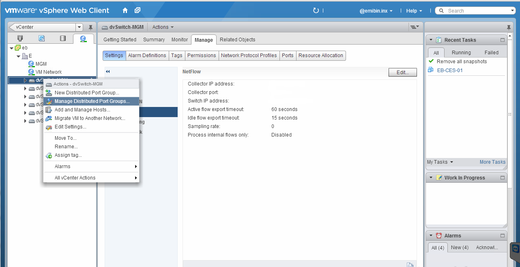
Select the dvSwitch in which you want to activate NetFlow, and right-click for more options:
Select the Manage Distributed Port Groups option:
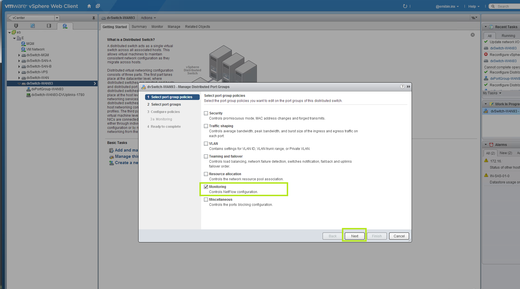
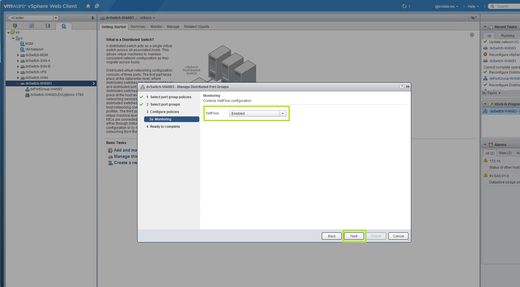
In this window, select the Monitoring check box, which includes the help tip Controls NetFlow Configuration:
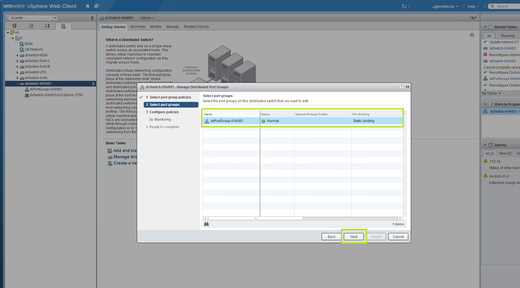
Select one or more dvPortGroup for which we want to activate NetFlow:
Select Enable to activate NetFlow:
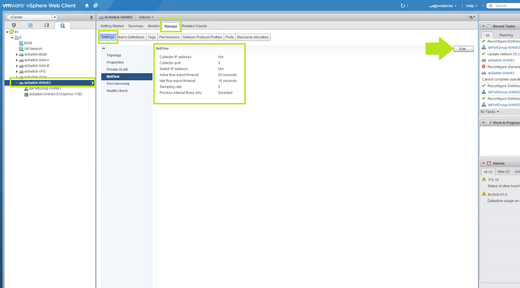
Now we are almost there, just go to Manage > Settings > NetFlow > Edit, for editing the NetFlow configuration in this dvSwitch:
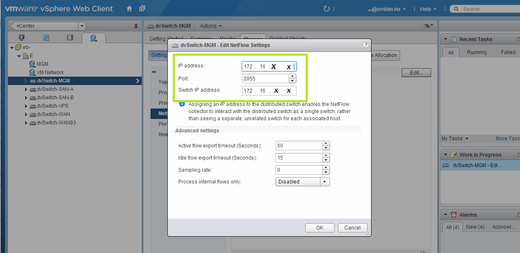
We need to fill in some information:
- IP address: The IP of our NetFlow Collector (this must be the IP of our PRTG server),
- Port: The port our Collector is listening in,
- Switch IP address: We need to use a management IP for this dvSwitch, with this, our Collector will obtain all the traffic. I recommend a Management IP Pool for this duties.
Well done! We finished the configuration of NetFlow in our VMware Environment. We need to repeat these steps in every single dvSwitch we want to monitor.
PRTG Network Monitor Configuration
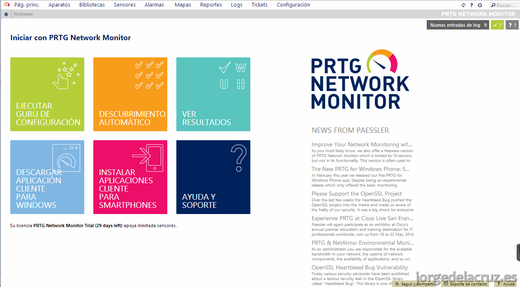
These previous steps have been in our VMware environment, now it's time to configure NetFlow in our PRTG server. PRTG looks very minimalistic and simple, but at the second glance it is very powerful and easy-to-use:
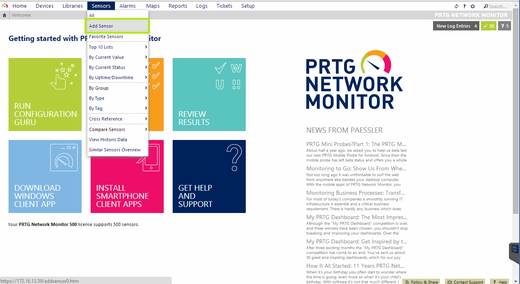
Now click on Sensors > Add Sensor:
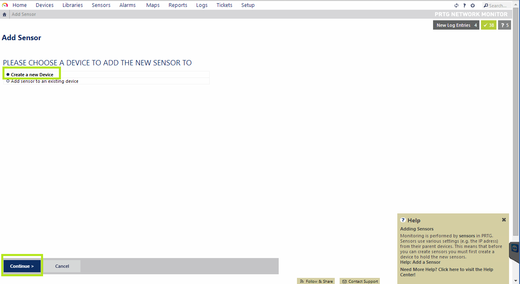
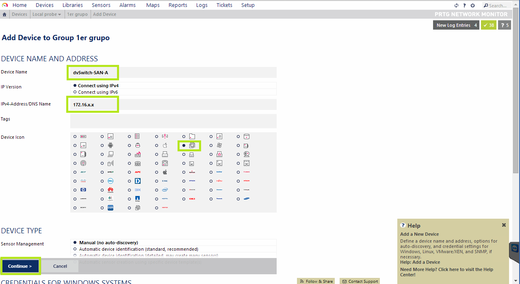
Select Create a new Device, to create our device (remember, the IP Address of our vDS that we created before, we need to create one new device per vDS):
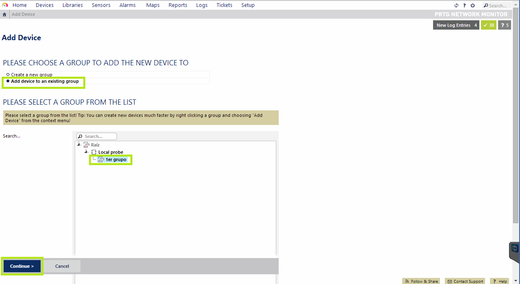
Select Add device to an existing group, or we can create a new one if we want:
When we put in a name, I recommend to always select a good name that will be quick and easy to find in case we want it in the future:
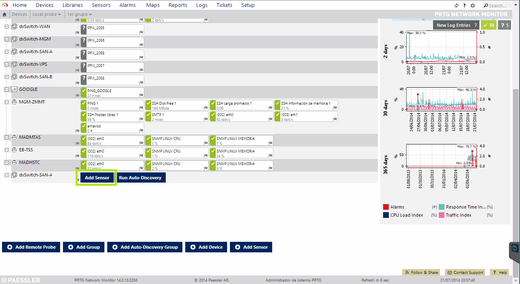
Once we created the Device, click in Add Sensor:
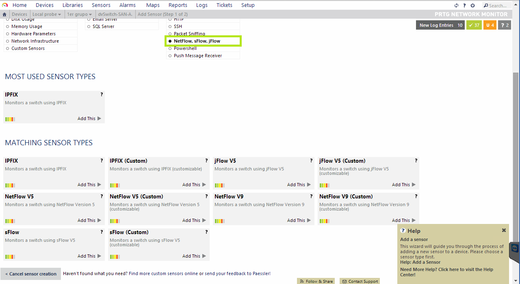
Under Technology Used, select NetFlow, sFlow, jFlow. I used IPFIX, after having problems using NetFlow V9. You can try it with NetFlow V9, and if it is also not working for you, just use IPFIX:
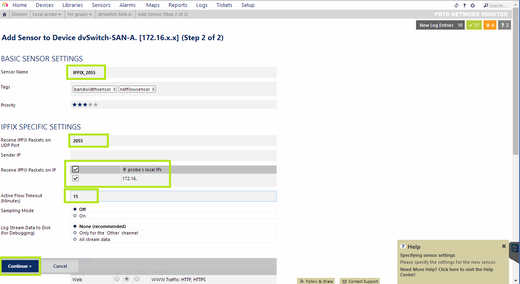
When we are configuring the Sensor, we need to put special attention to some things, select a descriptive name, use the correct port (remember the VMware configuration), the timeout, I used 15, you can play with this number, but be careful, if we put in less minutes we will no obtain any data at all:
We need to wait for 30 minutes, coffee time, and when we return, ta-da! We are done, we have our sensors obtaining detailed information about our VMware Environment:
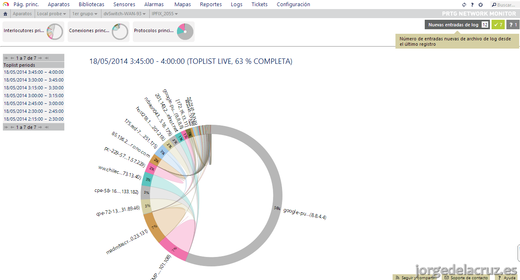
If we click in Top Talkers, we can see which one uses the most traffic and which one is the most visited IP. Very useful:
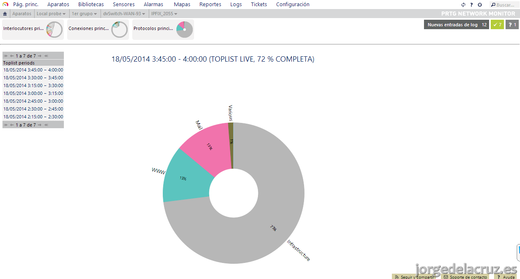
If we choose the Top Protocols, we can see which the most consuming traffic protocol in all our Virtual Network Environment is:
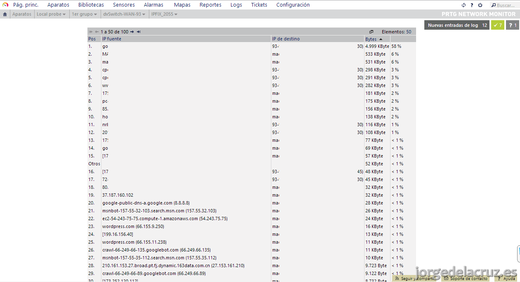
In the end, on the bottom of these pages, we can obtain a detailed table and we could also export it to CSV, about our Environment, for debugging purposes:
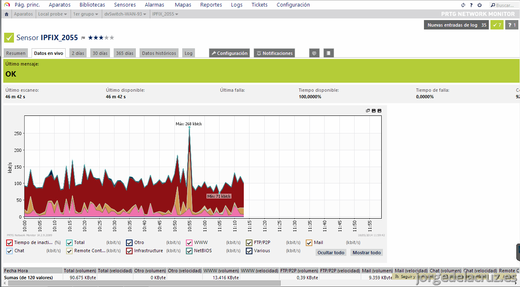
In a pretty flow view you can also see the real time usage for each of our vDS for detection and troubleshoot problems:
That's all folks, I hope that you enjoyed this entry about NetFlow, and that it will also be useful for you and your company. Thank you so much for reading!
 Published by
