 Published by JR Andreassen
Last updated on March 03, 2022
•
5 minute read
There are a lot of solutions to choose from that does load management and security for services, in this article we will be looking at Kemp Loadmaster.
KEMP Technologies offers “KEMP Loadmaster”, which, as the name implies, balances application loads between web servers. Their product offering includes both virtual and hardware appliances. The virtual offering supports most hypervisors and cloud deployment, and they have hardware appliances of varying sizes to support larger loads.
iVirtualization is the process of creating a virtual version of something like computer hardware. It involves using specialized software to create a virtual or software-created version of a computing resource rather than the actual version of the same resource. Read more ...
One of the great things about the KEMP, like PRTG, is that there's a free version available for download. You can download a virtual appliance and run it in your virtual environment. The free version has some restrictions but it’s great for testing, configuration, and lab use. The KEMP LoadMaster also does Reverse Proxy (we’ll refer to it as "Rproxy"), which, in addition to monitoring, is the focus of this article.
Monitoring KEMP LoadMaster
PRTG is a network monitoring tool, so we want to monitor the device status and performance. The KEMP provides this in a couple of ways: through SNMP and through their REST API.
The default discovery of the device gives us the generic SNMP sensors.
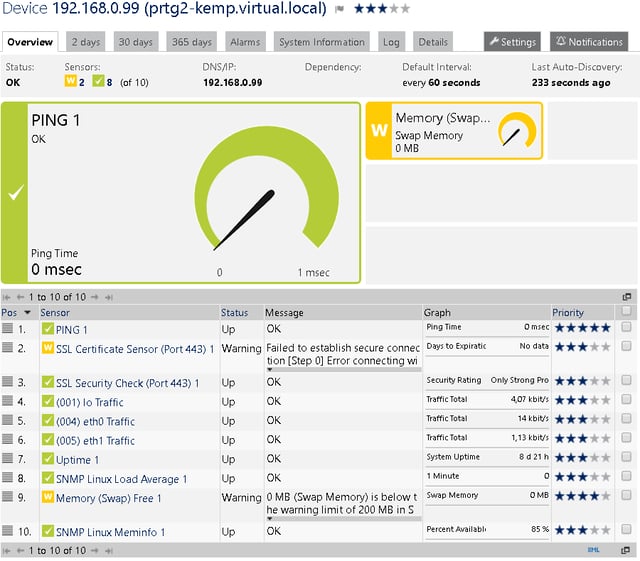
The information we are really interested in is how much traffic is it handling.
Using the MIBs supplied by KEMP and the Paessler tools, I created a template for the LoadMaster (available for download from PRTG Sensor Hub or directly from GitLab.com/PRTG). The template uses the SNMP Custom Advanced and SNMP Custom Table sensors to get some more information (the process is outlined in this Webinar "SNMP MIB basics – Monitoring with PRTG").
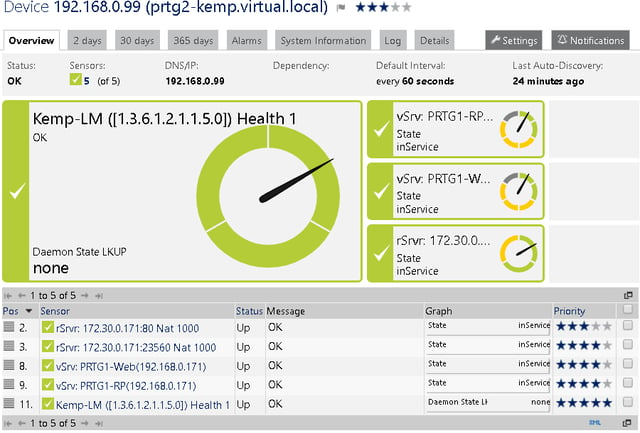
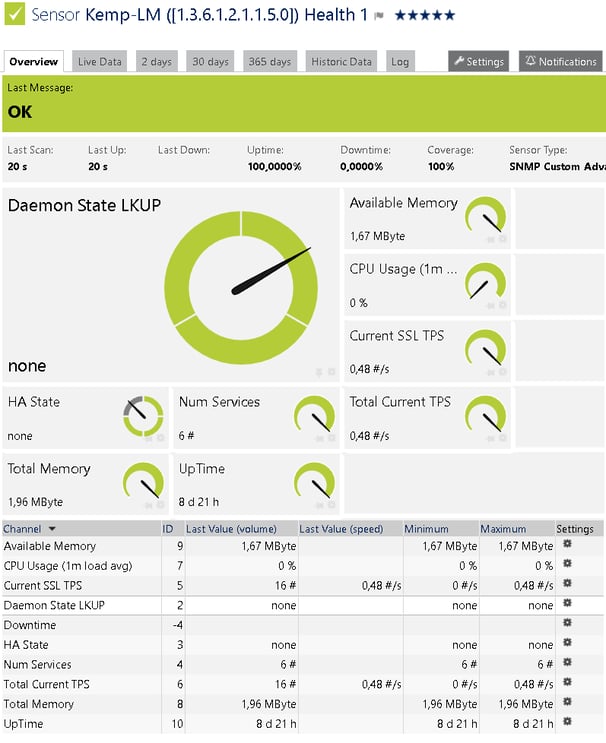
The template creates a health sensor, with a high level overview of the KEMP status and performance.
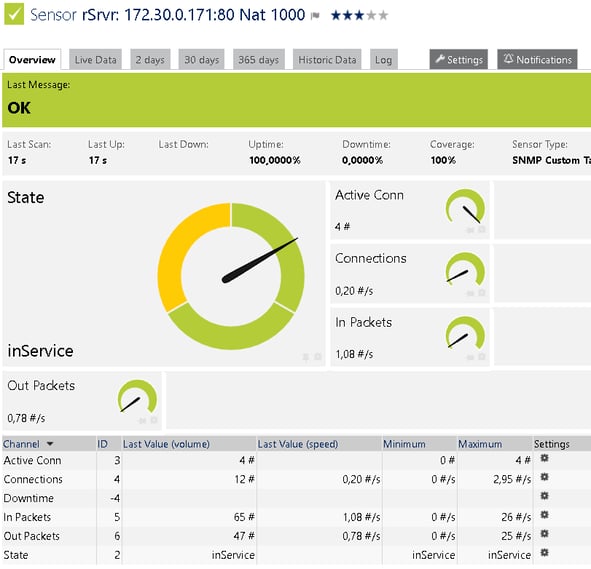
It also creates a sensor for each Virtual and real server with Metrics.
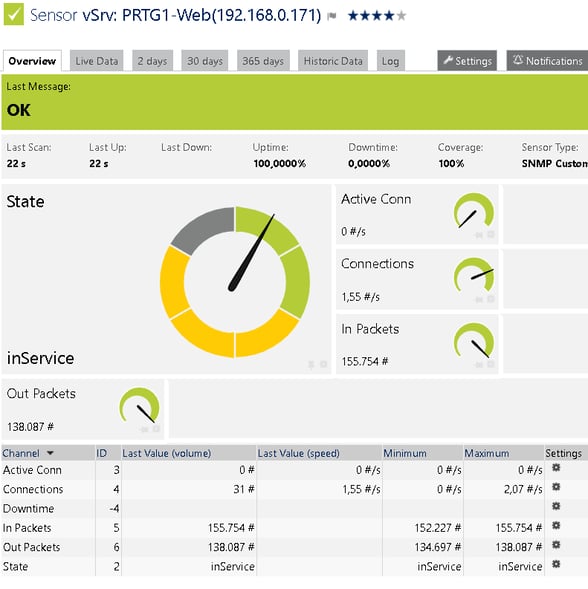
-
You may have noticed the sensors:
- rSrvr: 172.30.0.171:23560 Nat 1000
- vSrv: PRTG1-RP(192.168.0.171)
and - rSrvr: 172.30.0.171:80 Nat 1000
- vSrv: PRTG1-Web(192.168.0.171)
These are the sensors with performance metrics for the real and virtual servers. In particular, these are the sensors that measure the statistics related to the Rproxy that does the SSL offloading for PRTG’s remote probe and PRTG Web GUI respectively.
Monitoring KEMP Using the REST API
In PRTG version 17.3.33/34 we added a new sensor, the "REST Custom Sensor", which can also be used to get a top-level overview on how the KEMP is doing.
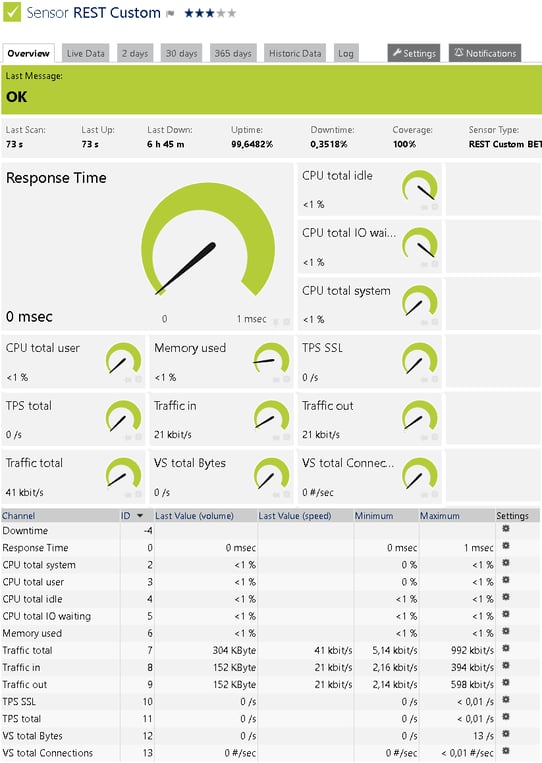
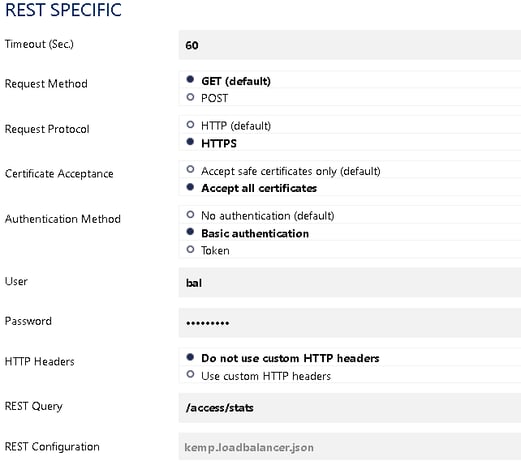
So, the next question is how do you configure it.
For installation details of the KEMP, please refer to the instructions on the manufacturer site.
Please note: We have carefully compiled this information and it is provided to the best of our knowledge. As the solution is not part of PRTG itself, it is not officially supported by Paessler or PRTG Technical Support. Yet, we wanted to share it with you as it might be of interest for many PRTG users.
You must also be aware, that if you configure any of the parts incorrectly, you may leave yourself open to an intruder gaining access to anything configured within PRTG. This includes User ID’s, Passwords, ip’s names, etc. IE no warranties expressed or implied. Paessler, its employees or partners cannot be held liable for any damages that you may incur as a result of employing a Reverse Proxy.


