Published by Sascha Neumeier
Last updated on November 28, 2024
•
6 minute read
In this article, I will show you how you can monitor digital business processes using Paessler PRTG Enterprise Monitor. Basically, IT systems are always involved as part of a digital business process. On the one hand, there are servers and network distributors, in other words the infrastructure, and on the other hand the applications, for example: database management systems, programs or protocols. For the user, it is important to know if a certain service or process is running from an end-user perspective, like a web shop or a CRM system. In most cases, the user is not interested in the granular details of the application and infrastructure layer.


The larger and more complex your company is, the more likely you are to encounter complex processes. Just as with your IT systems, your company's success also depends on process efficiency.
At Paessler, we originally started in the field of classic network monitoring. With PRTG Network Monitor, we have been successfully monitoring IT infrastructures for many years and can monitor practically anything that has an IP address or that is at least connected to a network-enabled device. With our built-in Business Process sensor, we can also monitor business processes.
“Business services provide a more structured presentation than boards. They organize data according to perspectives that show how the health and performance of components impacts different aspects of your business.”
Go big with Paessler PRTG Enterprise Monitor
Monitoring business processes is even more important for enterprise environments – namely, when you're no longer running ten or twenty servers, but two hundred or even two thousand! This is the point where completely new business requirements arise. Your structures are much more extensive, there are teams and workgroups for individual processes, but you still need an organization-wide overview.
This is where Paessler PRTG Enterprise Monitor can step in. For PRTG Enterprise Monitor, the license is by subscription and you only pay for the sensors you actually use. You can also scale horizontally and install an unlimited number of PRTG Core Servers.
Business Service Modeling
When building a business process, you will notice that not all stakeholders need the same amount of information. Management values the business impact, the service owner would like to know about the service level, and the engineer needs to know the root cause in case of failures.
Perspectives of Business Service Modeling
Therefore it is important to visualize the different perspectives of a business process. To demonstrate this, I have drawn up this table for you:
| End user | Is the end user able to use all the required services? |
| Application | How about the health status of the application components? |
| Network | Is the network performance sufficient? |
| Infrastructure | Are all required infrastructure components up and running? |
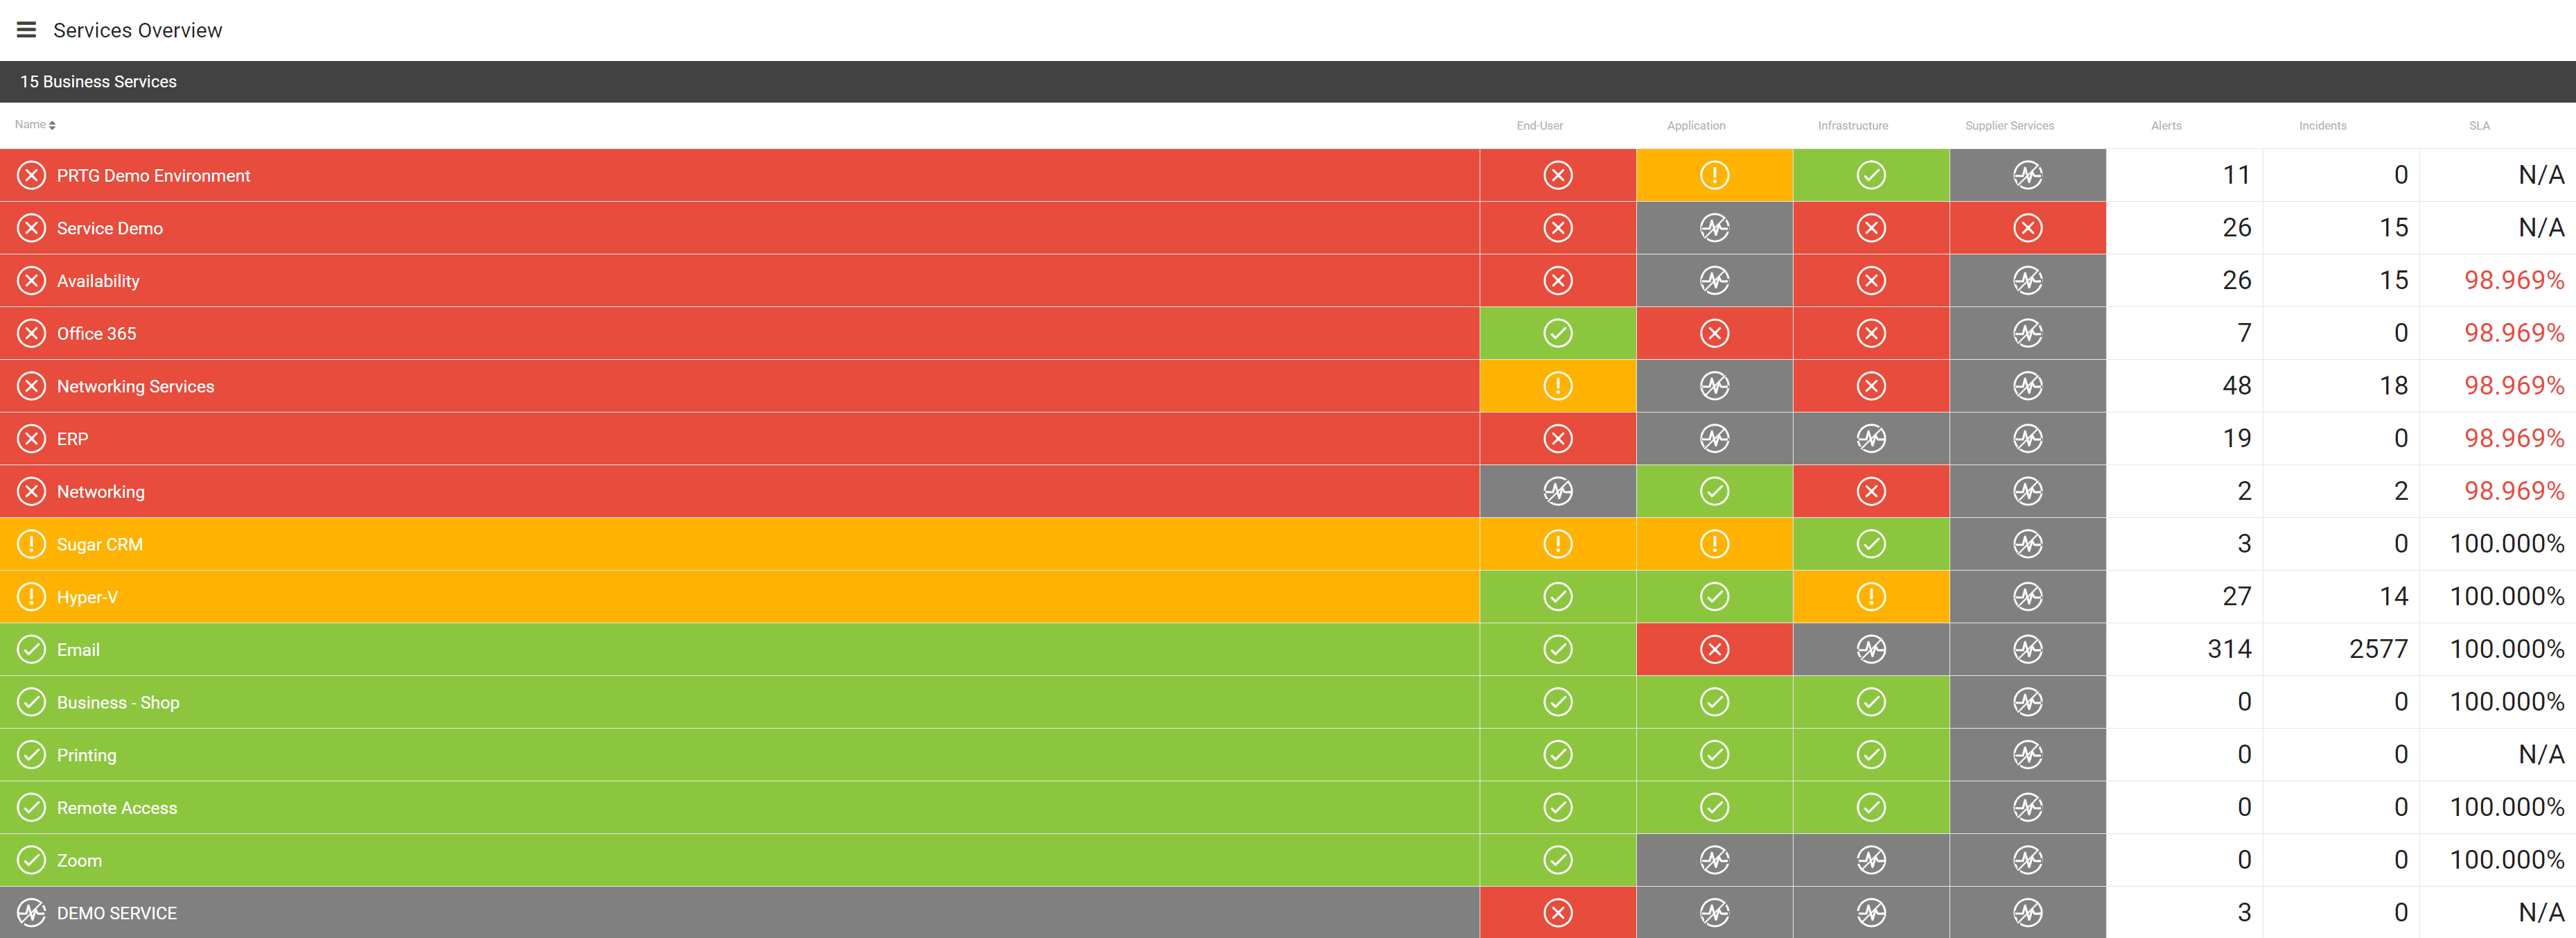
PRTG MultiBoard collects all necessary information from the various PRTG servers in the network and organizes it by business services. The business services are presented in a comprehensive dashboard. The different views (end user, application, infrastructure) are visible at a glance.
A real-life business process: CRM system
Enough about theory, let's look at one of these digital business processes. I dare to guess that you probably also work with a CRM system in your company. All customer-facing departments rely on its availability on a daily basis. They represent the end user perspective in this example.
The infrastructure perspective is also essential for the IT department. This can be either the on-premises server on which the CRM database and application are hosted, or the cloud components, for example the GCP, Microsoft Azure or Amazon Web Services environment.
The application perspective includes the CRM application, including its services, databases, interfaces, etc.
The end-user perspective shows whether the user can use the desired service or execute the corresponding processes without restrictions.
This view of the business process clearly shows that a process can be 100% available from an infrastructure or application perspective, while from an end user perspective there is no access to the CRM because the user is unable to see a login menu, to name just one example.
To find out more about how to configure business services, check out this Youtube Tutorial.
How do you notice an outage now?
If a business process is not fully available, the automated alarm management kicks in. Here, the respective roles and functions (the end user, the infrastructure team, the application admins, and so on) are individually notified. Consolidated notifications help ensure that outages are better noticed, rather than hidden in a flood of confusing, low-impact emails.
And there is more!
Pretty exciting, isn't it? But PRTG Enterprise Monitor can do so much more. To get an overview of the various features, I recommend our webinar on the topic. It is available in English as well as in German and you will learn in less than one hour how easy it can be to monitor even highly complex IT environments, including all related business processes.
Click on the button below to watch the English webinar. If you prefer the German version, just click here. For any questions about Paessler PRTG Enterprise Monitor, or if you would like to see a live demo, our team is always happy to help. Just visit this page and we will be in touch with you shortly!