 Published by Patrick Gebhardt
Last updated on November 26, 2025
•
18 minute read
Application monitoring is essential for maintaining optimal performance in today's digital environment. As a versatile APM solution, Paessler PRTG Network Monitor adapts to monitor applications with specialized sensors that track key performance metrics and provide comprehensive observability.

With pre-configured sensors for applications and services, PRTG makes it easy to monitor the following:
- Mail server monitoring with latency and response time tracking
- Microsoft application server monitoring for SharePoint and IIS optimization
- Backup monitoring with automated error tracking
- Windows system application monitoring including CPU utilization
- Database monitoring with real-time performance metrics
- Web application monitoring with synthetic monitoring capabilities
- Monitoring of various other services supporting cloud-native and on-premise work
PRTG also supports users in building complete application performance monitoring that goes beyond simple uptime monitoring, incorporating comprehensive performance metrics into your central monitoring solution:
- Advanced data visualization and real-time dashboards
- Enterprise-grade monitoring for modern digital experience management
- One central point of information for all applications and dependencies

Most companies rely on high-performing email systems for daily business communication. Any performance issues can affect all employees within a company. Therefore, it's vital to monitor mail server applications with specialized APM tools. PRTG monitors POP3, SMTP, and IMAP mail server types with special sensors that track response time, latency, and ensure they're ready to send or receive messages.
Microsoft Exchange Performance Monitoring
 Monitoring an Exchange Server, Including the Different Mail Queues
When running a Windows Exchange server, PRTG provides specific sensors to monitor performance metrics including mail queue sizes, delivery latency, response time, user experience metrics, and CPU utilization. There's a dedicated sensor showing transport queue lengths across over 30 different queues, enabling comprehensive troubleshooting and root cause analysis.
 Exchange Parameters at a Glance
Round-Trip Email Testing with Synthetic Monitoring
Advanced synthetic monitoring capabilities enable round trip monitoring that measures end-to-end response time for email delivery. PRTG sends test emails via SMTP to external accounts and constantly monitors target mailboxes via IMAP or POP3. This application monitoring approach helps identify performance bottlenecks and latency issues. You can configure thresholds for maximum acceptable response time, with immediate notifications when limits are exceeded.
 Email Round Trip Sensor monitors the time necessary for email delivery
PRTG supports specialized monitoring for SharePoint and Internet Information Services servers, providing comprehensive application performance monitoring for these critical business apps.
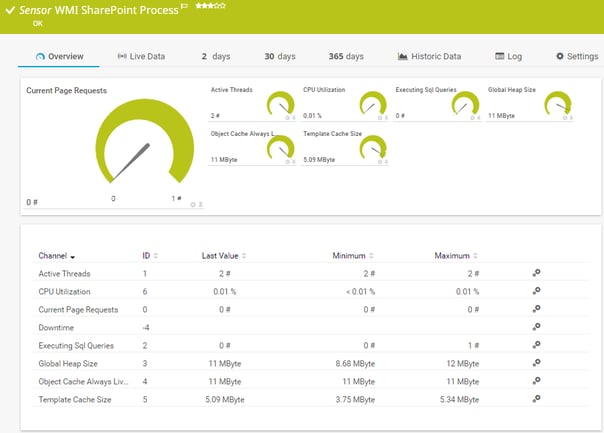
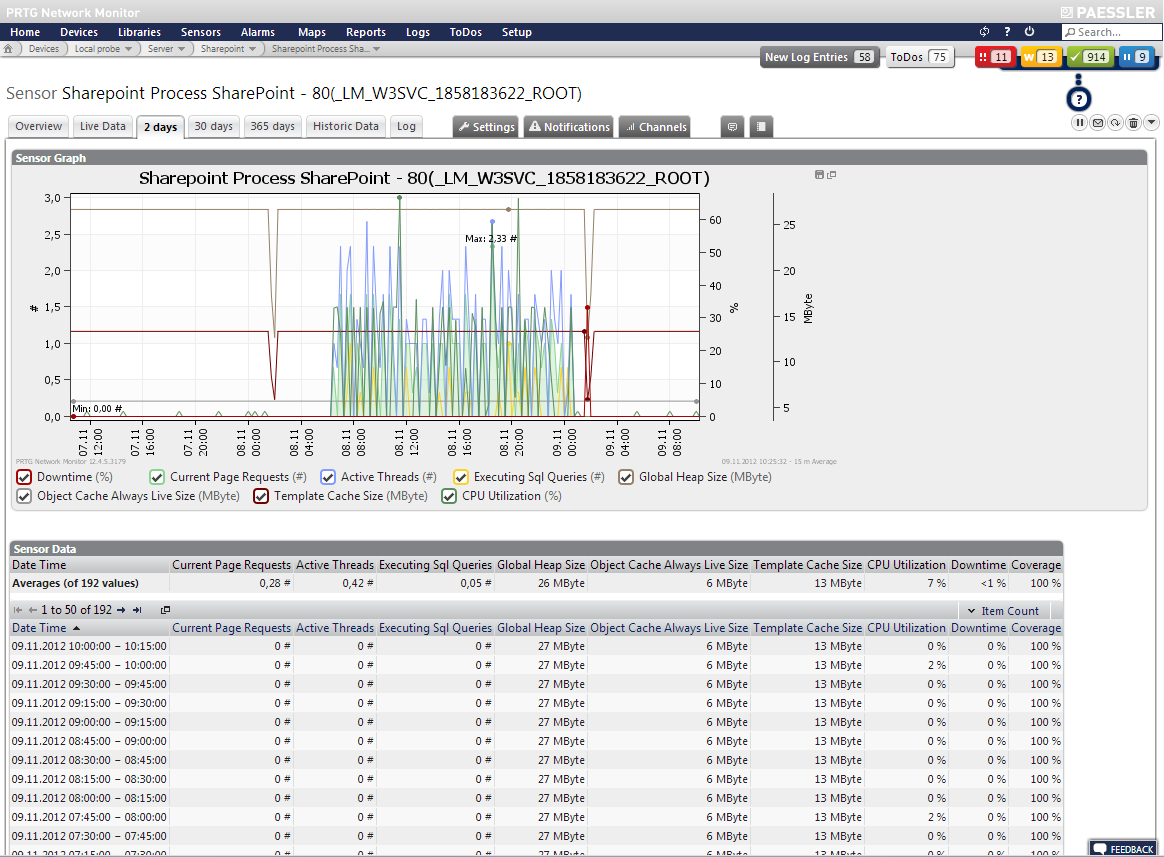
SharePoint Server Performance Metrics
For SharePoint environments, PRTG collects real-time metrics including current page requests, active threads, CPU utilization, and SQL queries currently executing.
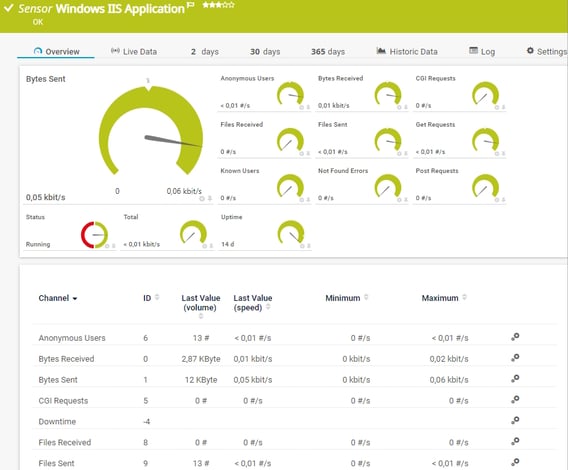
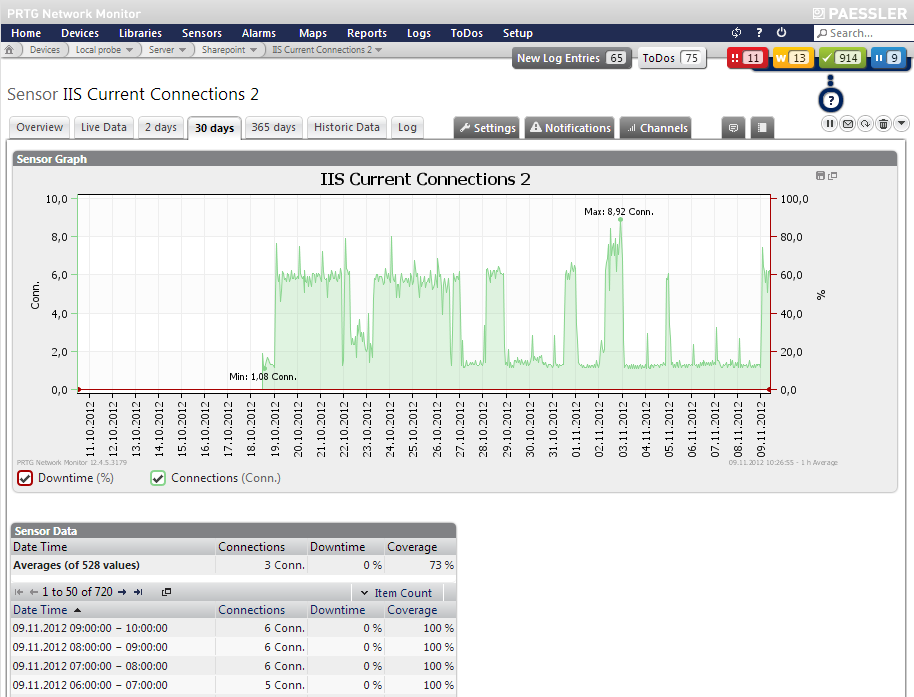
Internet Information Services (IIS) Application Monitoring
IIS monitoring provides detailed performance metrics including bytes sent/received, request response time, users per second, and other critical application performance indicators. These sensors automatically monitor vital parameters, enabling immediate detection of performance issues and bottlenecks.
For comprehensive backup monitoring, PRTG's IMAP sensor with advanced filter options provides a universal monitoring solution. Most backup solutions send email notifications indicating success or failure, supporting automation in your DevOps workflow.
Configure backup software to send emails to dedicated accounts, then set up IMAP sensors to check regularly for specific keywords in subject lines and message bodies. This automation approach provides notifications when no emails are received during specified time spans, ensuring comprehensive error tracking and alerting.
 Filter settings of the PRTG IMAP Monitoring Backup Sensor
For more information about backup monitoring, please see our blog article Monitoring Backup Solutions via Email.
PRTG offers several sensor types for monitoring Windows applications and services with comprehensive observability.
Windows Service Performance Monitoring
The WMI Service sensors monitors Windows services on target computers, tracking CPU utilization and resource usage. It can automatically restart "hanging" services when detected, providing automated troubleshooting capabilities.
 Parameters monitored with the PRTG WMI Service Sensor
Security Center Monitoring with Real-Time Alerts
 Overview of the PRTG WMI Security Center Sensor
The Security Center sensor queries Windows security centers for status updates. If it detects missing anti-malware software or outdated signatures, you receive immediate notifications. This provides additional monitoring layers for mail servers and other critical applications.
Database servers require specialized APM tools for optimal performance. PRTG sends queries and checks results including response time, record count, and performance metrics. Out-of-the-box support includes Oracle, MySQL, Microsoft SQL, and any other database supporting the ADO interface.
For Microsoft SQL database servers, there is dedicated sensor type user connections, logins/logouts, and comprehensive performance metrics, enabling end-to-end application dependency monitoring.
 Monitoring parameters seen in the PRTG Microsoft Azure SQL Database Sensor
 Performance statistics as seen in the PRTG WMI Microsoft SQL Server 2019
PRTG's HTTP sensors provide comprehensive web application monitoring including:
-
Response time monitoring for user experience optimization
-
Synthetic monitoring with transaction sensors simulating user workflows
-
Error rate tracking and performance issue detection
-
Full web page rendering for visual monitoring history
-
API monitoring for cloud-native applications
The transaction sensor excels at monitoring complex applications like e-commerce platforms, simulating complete buying processes. Only when all actions complete successfully does the sensor return "OK" status, enabling immediate detection of performance bottlenecks or downtime.
 Monitoring metrics seen in the PRTG HTTP v2 Sensor
PRTG includes comprehensive sensors for diverse application monitoring use cases:
- Monitor the functionality of a DHCP service in your network
- Monitor time servers via SNTP
- Monitor FTP servers (incl. file count and TFTP)
- Monitor DNS services (incl. blacklist monitoring)
- Monitor LDAP
- Monitor RADIUS servers
- Monitor open/closed ports
- Monitor the number of trace route hops
 Comparison of DNS Server Loading Times (Data of 1 Year)
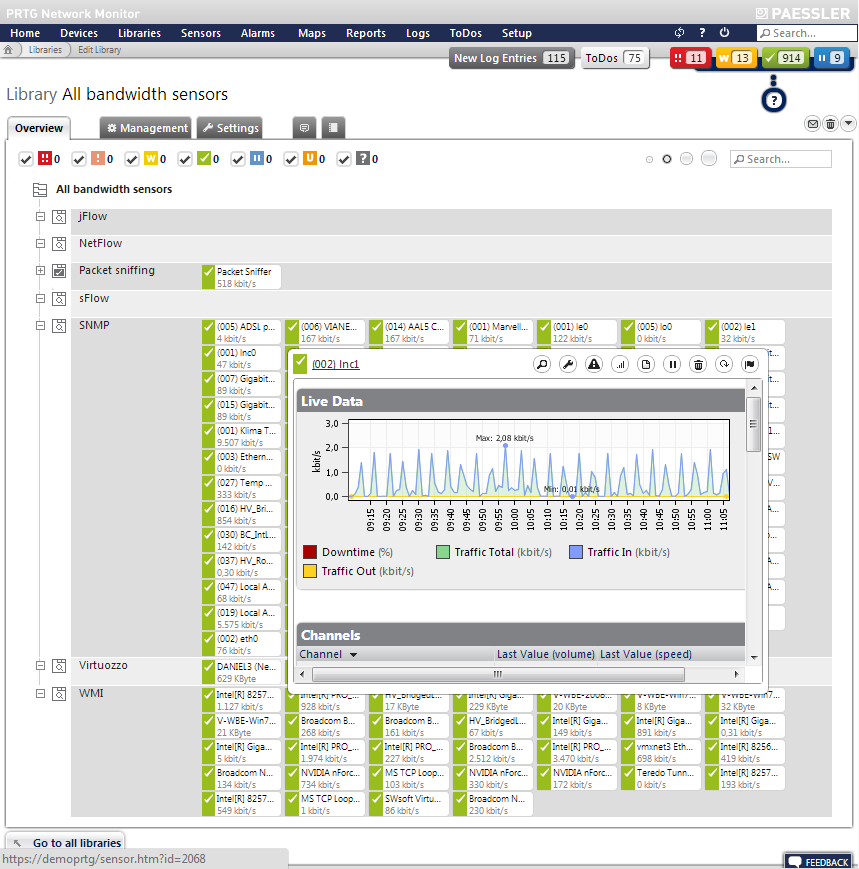
Multiple visualization options provide comprehensive observability for your monitored applications. Access all performance metrics directly in the PRTG device tree, create on-demand ad hoc reports spanning any time periods, and utilize raw data for detailed analysis.
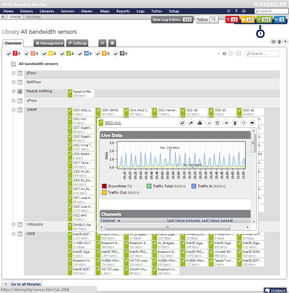
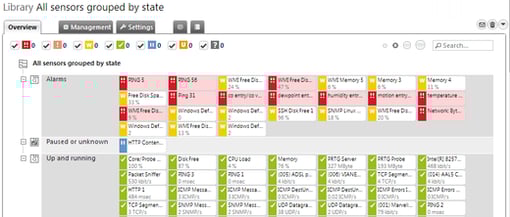
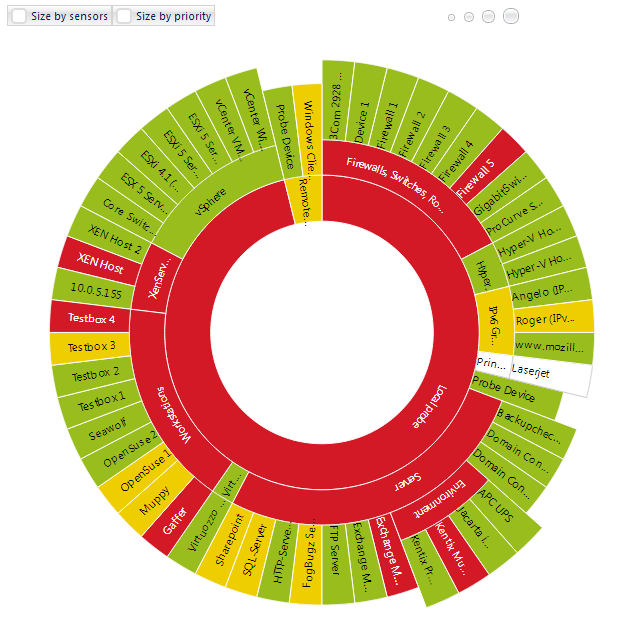
Libraries allow alternative views of the device tree, as well as further easy filtering options. This enables you, for example, to create lists of sensors used to monitor one dedicated application or service and display these sensors together, regardless of what device they're originally running on. You can also tag the desired objects in your device tree and let PRTG put together your library automatically by displaying all objects with a specific tag. This way, new objects will be added automatically to existing libraries.
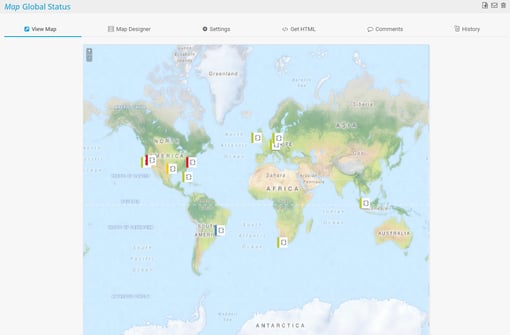
Custom Dashboards and Maps
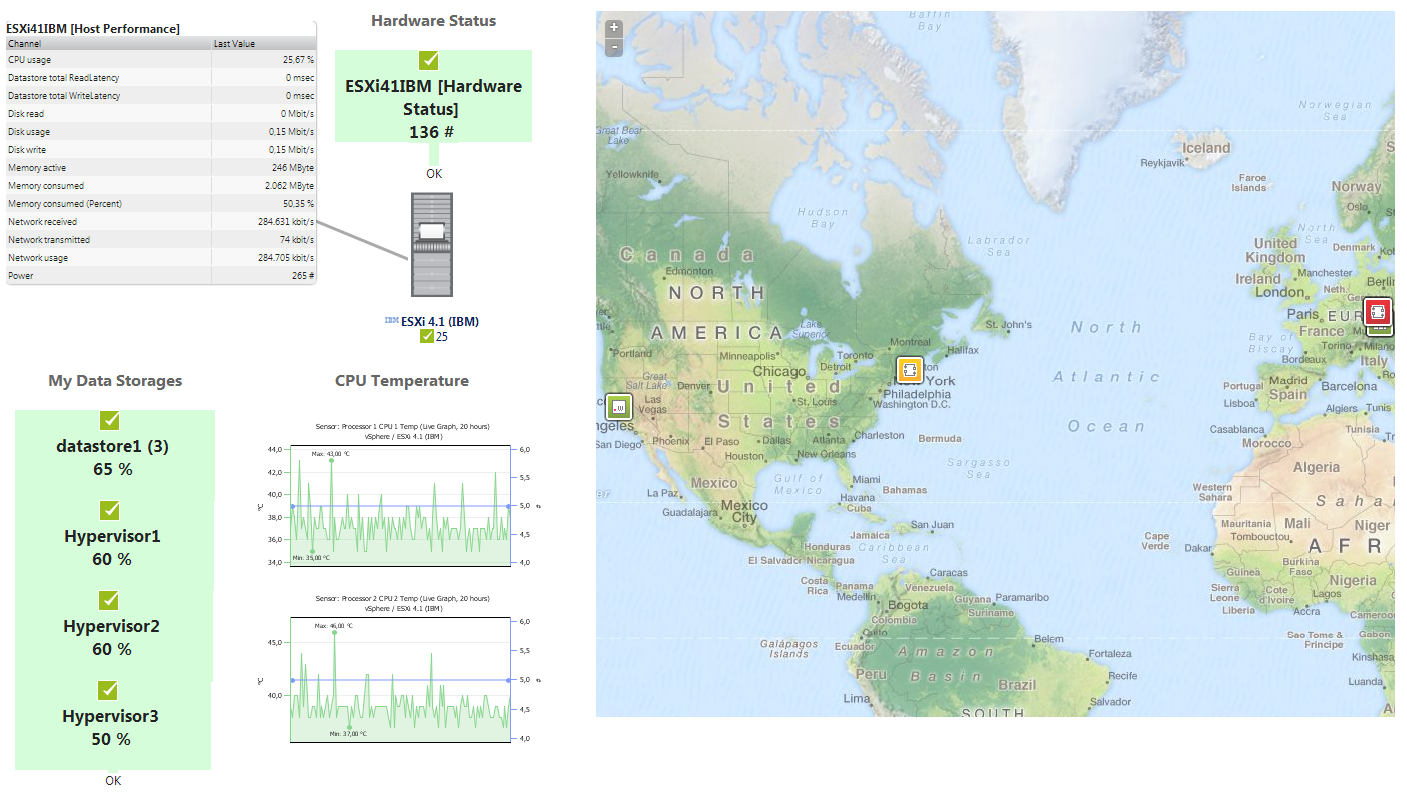
If you are looking for an even more general and easy to read presentation modus, the customizable PRTG Maps bring together live monitoring status, graphs, and tables of all sensors monitoring one application, using your personalized layout as well as lines, custom objects, or your own pictures.
Classic reporting is available, where you can schedule regular reports, e.g. in PDF format, and use them for demand analysis, or to prove SLAs. Reports can also be sent automatically, for example, quarterly reports on bandwidth usage for your CEO.
Enterprise-Grade Monitoring for Modern Digital Experience Management
Cloud-Native Infrastructure and Advanced Debugging
PRTG delivers full-stack monitoring capabilities that extend beyond traditional on-premises environments. With dedicated sensors for AWS and Azure cloud platforms, IT teams can monitor hybrid infrastructures seamlessly.
The platform supports Kubernetes container monitoring through custom sensors available in the PRTG Sensor Hub, enabling comprehensive oversight of modern pipelines and containerized applications.
Advanced debug options provide detailed troubleshooting capabilities, while comprehensive telemetry collection enables correlation of performance metrics across all monitored systems.
This code-level visibility extends to monitoring CI/CD pipelines, ensuring continuous integration processes maintain optimal performance.
SaaS Monitoring and Enterprise Integration
PRTG includes built-in SaaS monitoring through the Common SaaS sensor, tracking availability of major software-as-a-service providers.
Real user monitoring functions provide insights into actual user monitoring experiences, measuring digital experience metrics that directly impact business operations. The platform supports enterprise-grade notification systems including Slack integration through custom scripts and webhook configurations.
PRTG's flexible pricing model includes free trial access and scalable licensing options. While focusing on comprehensive monitoring rather than distributed tracing, PRTG provides full-stack observability through correlation of metrics across network, application, and infrastructure monitoring layers, supporting comprehensive vulnerability detection across all monitored services.
These enterprise features ensure PRTG delivers comprehensive monitoring solutions that scale from small networks to large enterprise deployments, supporting modern IT environments with cloud-native applications and complex distributed architectures.
One central point of information for all applications
Paessler PRTG provides comprehensive application performance monitoring across your entire infrastructure, including devices, direct infrastructure, application servers, and detailed performance metrics. When services become unreachable or thresholds are breached, you receive immediate notifications through multiple channels.
Key Benefits:
-
End-to-end observability for distributed applications
-
Real-time performance metrics and error tracking
-
Automated notifications and troubleshooting workflows
-
Scalable monitoring solutions from on-premises to cloud-native
-
API integration for DevOps automation
-
Comprehensive dashboards with advanced visualizations
Ready to implement comprehensive application performance monitoring? Download your free PRTG trial and start monitoring your applications with advanced APM capabilities today!


