If you have read all previous articles of this blog series, you're already quite an expert on how to utilize the PRTG Mini Probe API for your monitoring needs.
Important information: Note that the PRTG Mini Probes are a proof of concept. We tested them carefully, however, we cannot offer deep technical support for them nor for your own Mini Probe writing. Moreover, we do not further develop the currently available Mini Probe API because we plan major changes to the underlying API in PRTG. All steps and features described in this article are for your information only.
Which Possibilities Does PRTG Offer to Monitor Java?
In comparison to other monitoring tasks, JMX monitoring requires an advanced approach because of its potential complexity. You can, for example, keep an eye on your Java infrastructure via SNMP (Simple Network Management Protocol) by enabling the SNMP Agent of your JVM (Java Virtual Machine) to gather basic information about the JVM itself. If you want to gather data on the applications running on the Java VM, you can integrate your own SNMP interface into the JVM. Although being a very flexible solution, the implementation effort is quite extensive (see the Paessler Knowledge Base article on "JVM (Java Virtual Machine) Monitoring" for more information).
Another solution is to install a small piece of software on the target system, which allows you to monitor data more easily. One possibility PRTG offers is the HTTP Push Data sensor and the other brand-new one is using the PRTG Mini Probe API. With the JMX Mini Probe we created a proof of concept that can run on any Java VM and enables you to monitor it via JMX.
How Can You Put the JMX Mini Probe to Use?
Just like the Python Mini Probe, the JMX Mini Probe is a proof of concept, which demonstrates the capabilities of the PRTG Mini Probe API. It is completely customizable and offers a set of sensors that are perfectly aligned to their area of application. The JMX Mini Probe is written in Java and can run the monitoring processes in standalone mode or in an application container. The results are delivered back to the PRTG core server via the PRTG Mini Probe API.
If you have further functionalities in mind, don't hesitate to change and enhance this open source implementation to meet your own monitoring needs. With the JMX Mini Probe, we want to provide you with a starting point for creating your own probe for JMX.
How Do You Set Up the JMX Mini Probe?
Setting up the JMX Mini Probe is easy: First you need to prepare your PRTG server and allow it to receive mini probe connections. Then prepare and start the mini probe itself by downloading the JMX Mini Probe package from our GitHub repository. You then can choose between two options:
- Starting the JMX Mini Probe in standalone mode in its own virtual machine, or
- Adding it to an application container.
After the JMX Mini Probe is connected and running, you can start working with it in the PRTG web interface and, for example, add sensors, review monitoring data, create notifications, and so on.
By default, the JMX Mini Probe is equipped with the following set of sensors to monitor Java applications via Java Management Extensions:
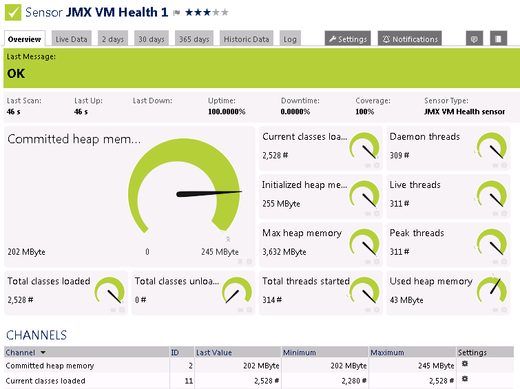
- JMX VM Health sensor for monitoring various health parameters for the JVM, for example, information about heap memory, threads, and loaded classes, and
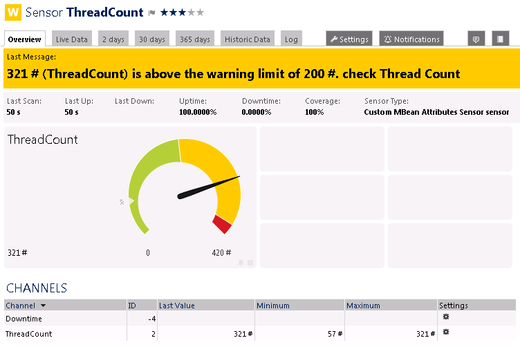
- Custom MBean Attributes sensor for monitoring previously defined MBean attributes like, for example, Disk (bytes), Memory (bytes), Bandwidth (bytes), CPU (%), Count, Percent, and File (bytes).
If you want to get started right away, just visit GitHub and download the JMX Mini Probe. For a detailed step by step guide on the installation process, please read our comprehensive Knowledge Base article on "JMX Monitoring with the PRTG Mini Probe".
If you want to share your own mini probe with other users, or want to discuss your approach, feel free to use the Paessler Knowledge Base, or contact us via e-mail: probes@paessler.com
The Complete Series
Have you already tested the PRTG Mobile Probe for Android, read about the PRTG Mini Probe API, or experimented with your very own Python Mini Probe? Just take a look at the other interesting articles of this blog series:
- PRTG Mini Probes - Part 1: The PRTG Mobile Probe for Android
- PRTG Mini Probes - Part 2: The PRTG Mini Probe API
- PRTG Mini Probes - Part 3: The Python Mini Probe for Linux
- PRTG Mini Probes - Part 4: The JMX Mini Probe for Java Applications
 Published by


