After having read the previous article of this blog series, you know what you can achieve with the PRTG Mini Probe API. To quickly summarize: The API allows you to develop your very own kind of probe by tailoring it to the requirements of your network without being restricted by hardware or operating system. This article shows you a proof of concept for an often requested area of application: Detailed monitoring of Linux systems with probes that run directly under the target system. Using the PRTG Mini Probe API, you can now create and use a Python Probe to monitor your Linux system directly.
Important information: Note that the PRTG Mini Probes are a proof of concept. We tested them carefully, however, we cannot offer deep technical support for them nor for your own Mini Probe writing. Moreover, we do not further develop the currently available Mini Probe API because we plan major changes to the underlying API in PRTG. All steps and features described in this article are for your information only. You can still use the Python Mini Probe, for example, if the available HTTP push sensors are not sufficient for your needs.
Which Possibilities Does PRTG Offer to Monitor Linux?
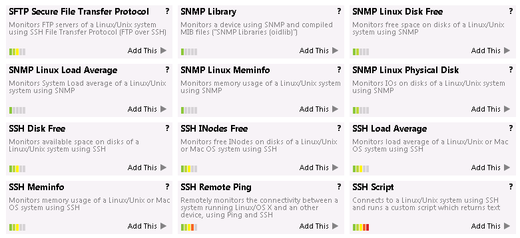
PRTG Network Monitor already offers a set of native sensors for Linux monitoring without the need for a probe running directly under Linux. These sensors gather monitoring data via SNMP (Simple Network Management Protocol), SSH (Secure Shell), or WBEM (Web-Based Enterprise Management) and run on the Local Probe or the Remote Probe of a Windows system located in your network. With these sensors you can, for example, monitor:
- The load average of a Linux system (via SSH or SNMP),
- The available memory in total and in percent (via SSH or SNMP),
- The total free disk space, and the free disk space in percent for every mounted partition
(via SSH or SNMP), - The traffic on a device using (via SNMP), or
- Create custom queries (via WBEM).
If you need to monitor a part of your network you don't or can't have a Windows system running in, or you want to install the probe on a dedicated Linux server to gather monitoring data directly from the target device, the PRTG Mini Probe API now offers you the tools to do so. To demonstrate its capabilities, we have created the Python Mini Probe—a proof of concept that provides you a starting point for implementing your very own probe for Linux.
How Can You Put the Python Mini Probe to Use?
Despite being a proof of concept, we wanted to make the Python Mini Probe actually usable and easily understandable for everyone who is planning to implement a similar PRTG Mini Probe. It is written in Python, runs the monitoring processes directly on a Debian based system, and delivers the monitoring results back to the PRTG core server via the PRTG Mini Probe API. We have successfully tested the Python Mini Probe on Debian, Ubuntu, and Raspbian Linux distributions—finally the highly anticipated option to install a probe directly on a Linux system is here, and you can tweak and enhance it to meet your specific monitoring needs.
Even if you don't have an immediate area of application in the back of your head, you might want to experiment with how easy it is to set up a cost efficient Linux probe. You can, for example, install the Python Mini Probe on a small Raspberry Pi, place it in your server room, and let it collect the monitoring data directly on-site—and that's only the beginning! If you love exploring new, exciting possibilities as much as the Paessler development team, you'll find ways to enhance the functionalities of this open source implementation to meet your own monitoring requirements.
How Do You Set Up the Python Mini Probe?
Before you start diving into the code of the Python Mini Probe, we want to provide you with a short overview of what you need to do in order to set it up on your Linux based system. First you need to prepare the Python Mini Probe and the PRTG server for installation by enabling them to send and receive monitoring data.
After having approved the new probe connection in the PRTG web interface, you can start working with the Python Mini Probe, just as you are used to with the Local Probe or Remote Probes: add sensors, review monitoring data, create notifications, and so on.
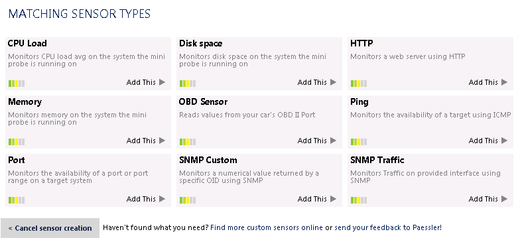
The Python Mini Probe contains the following set of sensors to monitor your Linux device—of course, you can adjust these default sensors and add even new ones to your probe:
- CPU Load for monitoring the CPU load (average) of the system running the mini probe,
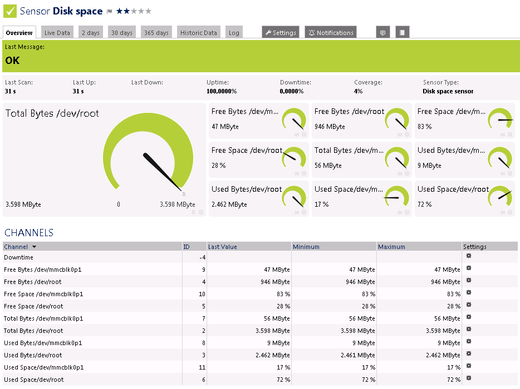
- Disk Space for monitoring its free disk space,
- HTTP for monitoring a web server via HTTP,
- Memory for monitoring the mini probe system's free memory,
- Ping for availability monitoring of a target device using ICMP,
- Port for checking the availability of a port on a target device,
- Probe Health for monitoring internal parameters to indicate the probe's health,
- SNMP Custom for monitoring a numerical value which is returned by a specific OID via SNMP, and
- SNMP Traffic for monitoring the traffic on a specified interface via SNMP.
If you want to get started right away, just download the Python Mini Probe directly from our GitHub repository. For a detailed step by step guide on the installation process, please read our comprehensive Knowledge Base article on "Monitoring Linux Systems with the PRTG Mini Probe".
If you want to share your own mini probe with other users, or want to discuss your approach, feel free to use the Paessler Knowledge Base, or contact us via e-mail: probes@paessler.com
The Complete Series
Have you already tested the PRTG Mobile Probe for Android and read about the PRTG Mini Probe API? Just take a look at the first two articles of this blog series! Also stay tuned for part 4, which will focus the JMX Mini Probe for Java Applications:
- PRTG Mini Probes - Part 1: The PRTG Mobile Probe for Android
- PRTG Mini Probes - Part 2: The PRTG Mini Probe API
- PRTG Mini Probes - Part 3: The Python Mini Probe for Linux
- PRTG Mini Probes - Part 4: The JMX Mini Probe for Java Applications
 Published by


