 Published by Shaun Behrens
Last updated on March 03, 2026
•
7 minute read
Let's be honest - REST APIs are everywhere these days. Your firewall has one. Your ticket system has one. Heck, even weather websites offer REST API endpoints you can query. And for IT admins like you? That's actually great news. Because it means you can pull almost any kind of data into your monitoring tool and keep an eye on things you might not have thought to monitor before.
Think about it. Want to track how many support tickets are piling up in real-time? There's an API for that. Need to check weather conditions that might affect your data center's cooling? Yep, API. The possibilities for use cases are pretty much endless once you start thinking in terms of API monitoring.
That's where Paessler PRTG comes in handy. The monitoring solution gives you the REST Custom v2 sensor - and unlike its predecessor, this version is now fully supported and way easier to work with. No more experimental features, no more beta warnings. Just straightforward REST API monitoring that actually works.
What the REST Custom Sensor V2 Can Do for You
The sensor itself is pretty flexible. It queries any REST API endpoint that returns JSON or XML, then maps those results straight into sensor channels. Whether you're monitoring performance metrics, checking response time, tracking error rates, or validating status codes - if the API returns it, PRTG can monitor it.
And here's the thing: you don't need to be a developer to set this up. Sure, you'll need the request URL from your API documentation (every manufacturer or website provides that), but once you have it, the configuration is surprisingly straightforward. The sensor handles authentication through various methods including OAuth, supports both JSON and XML responses, and lets you customize which metrics you want to track.
Ready to expand your monitoring beyond traditional network devices?
👉 Download PRTG for free and start monitoring REST APIs alongside your network infrastructure, Cisco equipment, DNS servers, and web services - all from one dashboard.
Setting Up REST API Monitoring: A Real Example
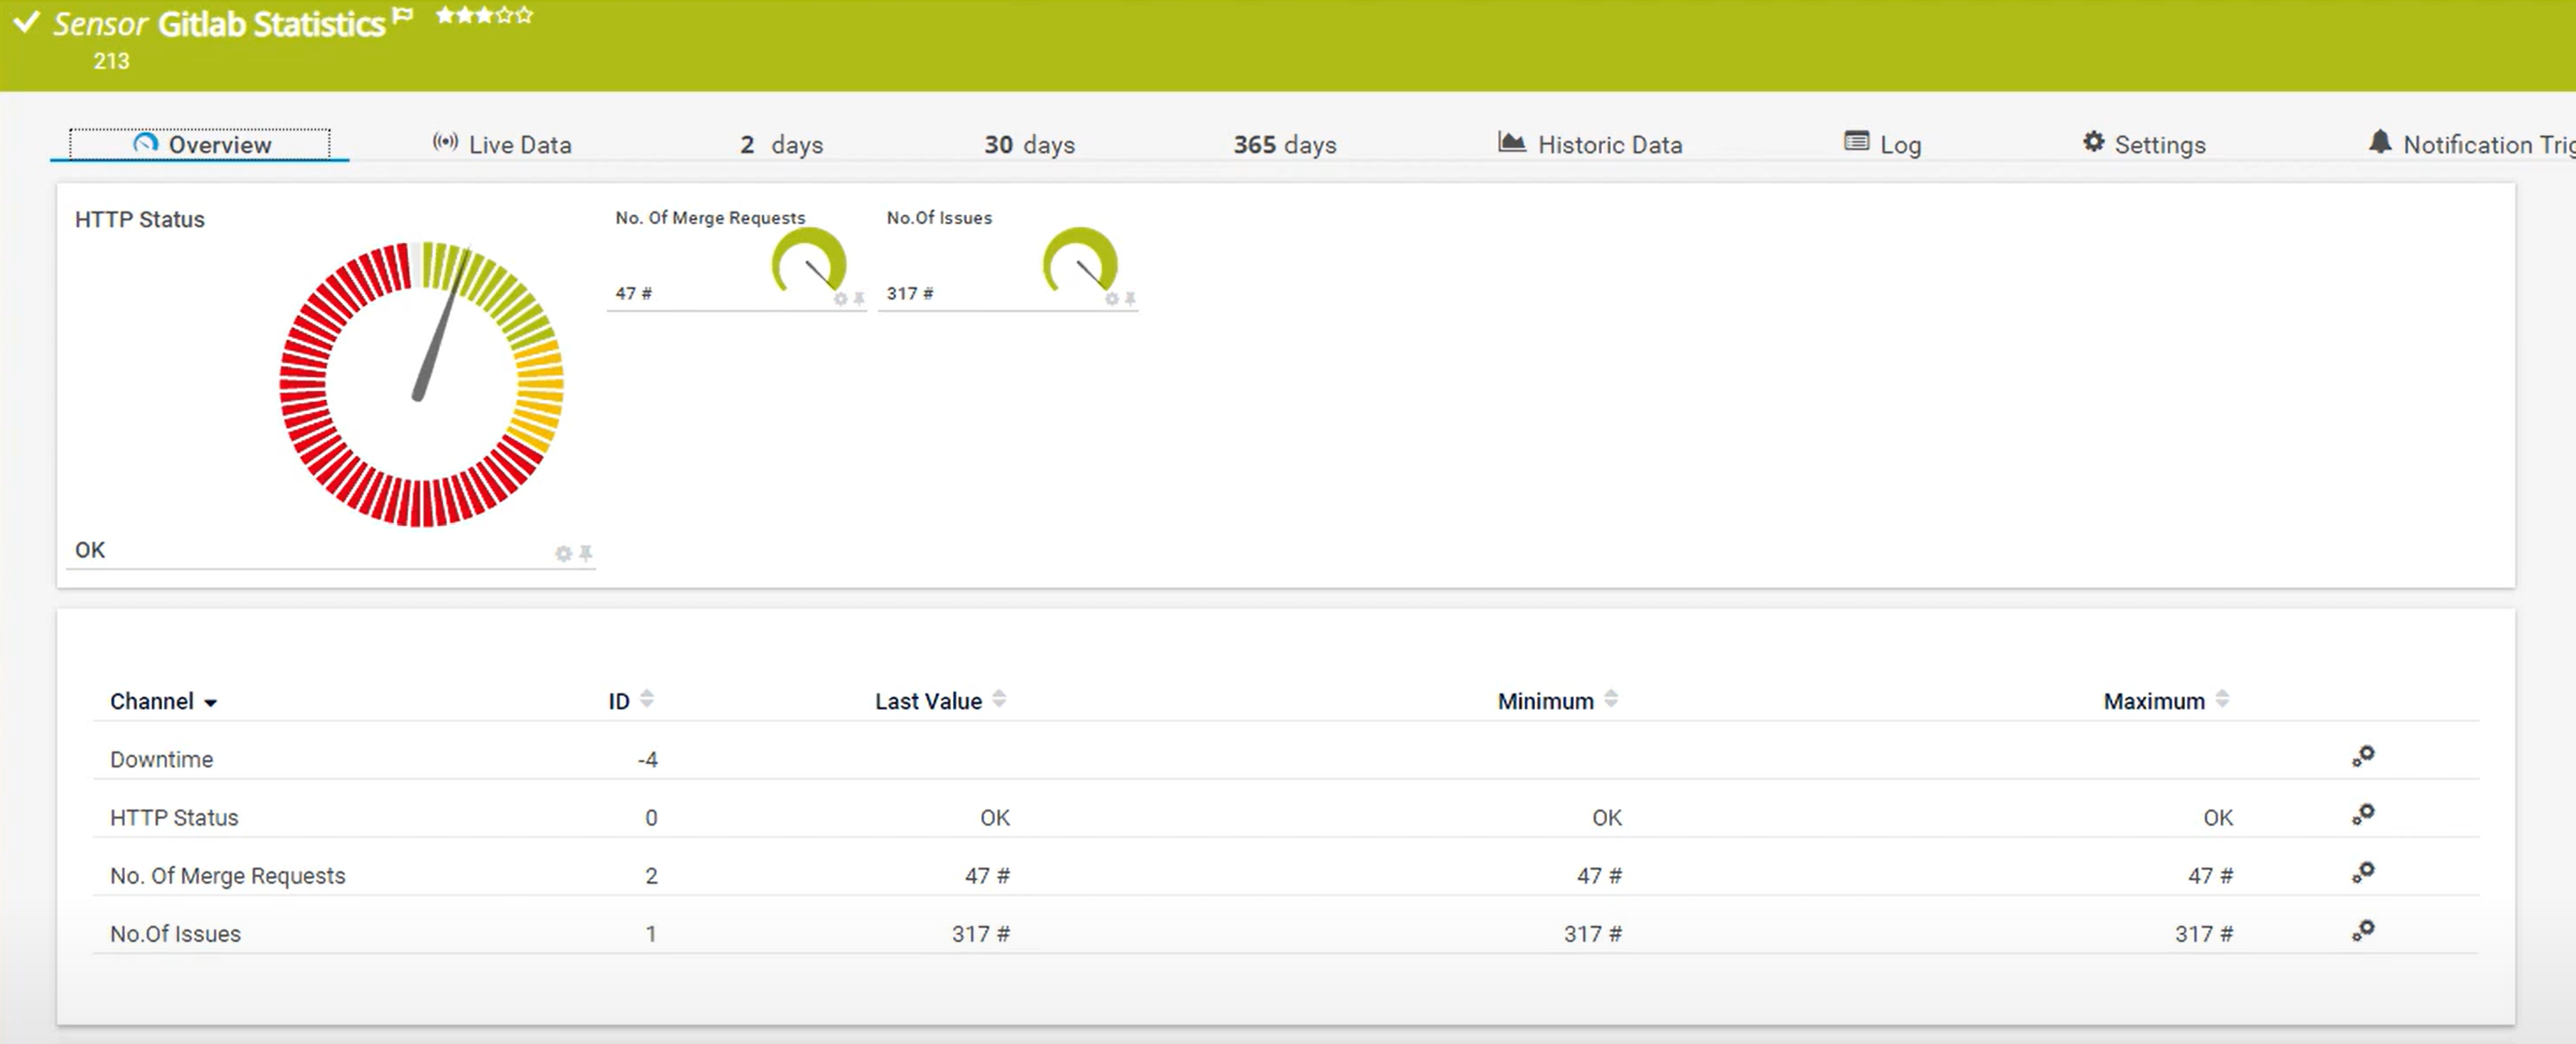
Let me walk you through a practical example. Say you've got a GitLab account and want to monitor things like the number of open issues or pending merge requests. GitLab offers a statistics API that makes this information available, and we can pull it directly into PRTG for performance monitoring.
The process breaks down into three main steps, though there's a bit more nuance to each one:
- Create a device in your PRTG device tree for GitLab statistics (you'll need to add your bearer token here for authentication)
- Add the REST Custom v2 sensor to that device
- Configure which channels you want and specify the exact metrics to display
What you end up with is a sensor that continuously monitors your GitLab API performance, tracks key metrics like issue counts, and alerts you if anything crosses your defined threshold values. The sensor updates in real-time, so you're always looking at current data - no delays, no manual checking.
Need a more detailed walkthrough?
📺 Check out our tutorial video on the REST Custom v2 sensor where we go through each configuration step.
Why This Matters for Your Network Monitoring
Here's where things get interesting. Most IT admins think of network monitoring as tracking servers, checking connectivity, watching bandwidth - the usual stuff. But API monitoring opens up completely different possibilities. You're suddenly monitoring the functionality of web applications, tracking the user experience of your services, and getting telemetry from systems that don't have traditional monitoring capabilities.
Some practical scenarios where this becomes invaluable:
- DevOps workflows: Monitor your CI/CD pipeline's API to track build times, deployment frequency, and automation metrics
- SLA compliance: Pull uptime data from third-party web services you depend on and validate they're meeting their commitments
- End-to-end observability: Combine REST API metrics with your existing SNMP and Ping sensors to see the complete picture
And because PRTG consolidates all this into one monitoring solution, you're not juggling multiple tools. Your REST API endpoint monitoring sits right alongside your firewall checks, your DNS monitoring, and your web application performance tracking.
Troubleshooting and Optimization
Of course, things don't always work perfectly on the first try. When you're setting up API calls, you might run into authentication issues, incorrect IP address configurations, or unexpected API response formats. The REST Custom Sensor V2 helps you troubleshoot these problems by showing exactly what the API returns and where the mapping might be failing.
Response time is another area where the sensor shines. If your API endpoint starts responding slowly, you'll see latency creeping up in your dashboard. That early warning can help you optimize performance before end users notice downtime or degraded functionality. And when you're tracking error rates alongside response time, you get a much clearer picture of overall API performance.
One thing I've noticed working with this sensor: paying attention to connectivity patterns helps prevent bigger issues. Maybe your API calls start failing at the same time every night - that could indicate scheduled maintenance you weren't aware of, or it might reveal vulnerabilities in your network infrastructure during off-peak hours.
Getting Started with REST API Monitoring in PRTG
The beauty of the REST Custom v2 sensor is that it doesn't require you to learn SOAP protocols or deal with complicated XML schemas (unless you want to). JSON endpoints work just as well, and most modern APIs default to JSON anyway. The sensor handles the heavy lifting - you just tell it which metrics matter to you.
Start small if you're new to API monitoring. Pick one REST API endpoint you already use - maybe a service you rely on daily - and set up basic monitoring for it. Watch how it behaves over a week. You'll quickly see patterns in response time, notice if uptime varies, and get a feel for what normal performance metrics look like for that particular endpoint.
From there, you can expand to more complex use cases. Monitor multiple node endpoints across your infrastructure. Track API metrics that directly impact user experience. Set up automation that responds when specific status codes appear. The REST Custom Sensor V2 gives you the functionality to build out whatever monitoring strategy makes sense for your environment.
Want to see how REST API monitoring fits into your existing setup?
👉 Try PRTG free for 30 days with unlimited sensors and no feature limitations. Monitor your REST APIs alongside everything else in your network - all from one comprehensive monitoring tool.


