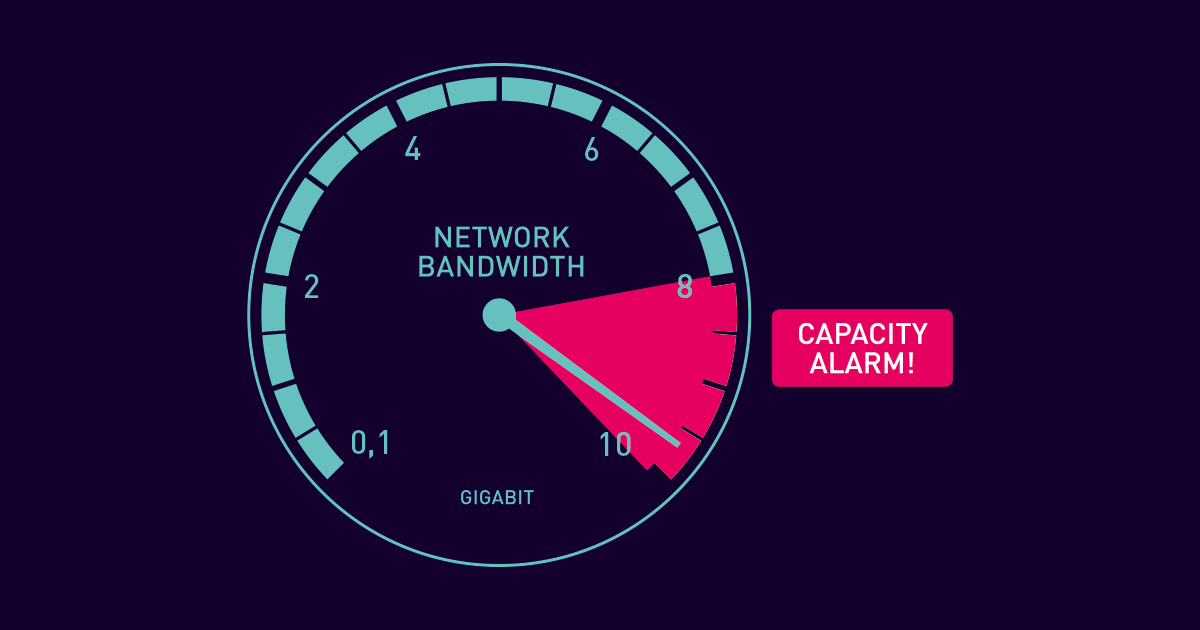
"Some applications on my computer are unacceptably slow!" Have you ever heard this from your colleagues? Maybe one of the first issues you think about as a system administrator is a bandwidth bottleneck, because limited performance of applications on the network may indicate a lack of available bandwidth.
Of course, there can be other reasons for poor performance of applications, for example, overloaded CPU or memory. With PRTG Network Monitor you will find out the causes immediately—in fact proactively, before anyone notices the issue. Likewise, you are able to have a close look at the bandwidth usage in your IT infrastructure. PRTG detects network congestion and helps you identify which resources you need to ensure sufficient bandwidth capacity. You can even differentiate bandwidth usage by network protocol and IP address and discern networks devices with excessive bandwidth consumption!
Bandwidth Monitoring Technologies
PRTG provides various technologies to monitor traffic in your IT infrastructure. You can use WMI, SNMP, Packet Sniffer, and various flow protocols (NetFlow, IPFIX, jFlow, sFlow). The best solution depends on your network and available resources:
- We recommend SNMP for most standard situations since it needs the least CPU and memory resources, but SNMP does not support differentiation of traffic by service and protocol.
- We recommend Packet Sniffer if you need differentiation of traffic by service and protocol. This sensor type can also show Toplists for the data, but packet sniffing creates the highest CPU load of the traffic sensors on the PRTG server. However, this works on every router on which you can set up a mirrored monitoring port.
- We recommend flow protocols and IPFIX for high traffic networks. You can use these sensor types with many Cisco, Juniper, and HP devices to measure bandwidth and you can also view Toplists, but it does require configuration of the network devices.
Discerning Excessive Bandwidth Usage
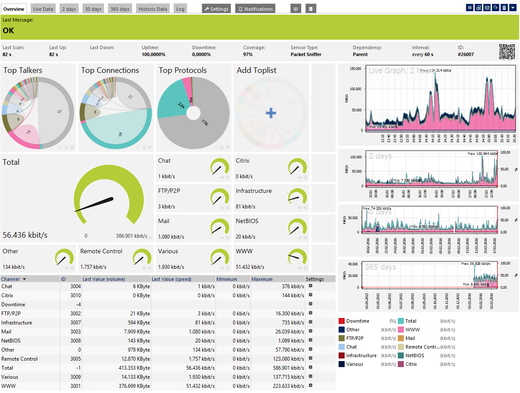
You are able to detect the network devices which consume the most bandwidth when using packet sniffing and/or flow protocols/IPFIX. These sensor types can break down network traffic by many different parameters, such as IP addresses, port numbers, protocols, in addition to measuring bandwidth usage. For this purpose, you can use specific filter rules. Using various flow and IPFIX sensors, the router gathers bandwidth usage data (flows), aggregates them, and sends information about these flows to PRTG via UDP packets. Toplists then show bandwidth usage by connection, protocol, and IP address.
PRTG's built-in Packet Sniffer analyzes all packets which pass the network card of a computer, or you can connect it to the monitoring port of a switch to calculate bandwidth usage. You can create packet sniffers anywhere in your network using remote probes. Just like flow protocols and IPFIX, you can view Toplists with all desired information about bandwidth usage.
Using traffic analysis, you can see recent and long-term bandwidth usage, recognize trends which are important for planning of resource enhancement, detect devices and applications with excessive bandwidth usage—and, because of this, you will always have enough bandwidth available to perfectly accomplish all your tasks!
You work with PRTG and would like to voice your opinion?
Leave a short review on Trustpilot. Thanks, your feedback is appreciated!
 Published by


