One of the most common (and frustrating!) questions a sysadmin needs to answer is: who is hogging all my bandwidth? Bandwidth hogging occurs when specific devices, apps, or users consume excessive network bandwidth, causing slowdowns for everyone else.
The network is slow, users are complaining, and your internet connection is at 100% bandwidth usage (again...). You need to figure out who or what is hogging all the available bandwidth, and you need to do it fast. In this article, I'll explain the different methods that are available in different situations, and how to use SNMP, RMON, flow and packet sniffing to track down the culprits.
The options that are available will depend very much on the hardware you're using, and how much management access you have to that hardware. To better asses your need, you should first answer the following questions:
Understanding Your Network Hardware Before Finding Bandwidth Hogs
1. What type of hardware do you have?
Enterprise-grade hardware offers many more possibilities than SOHO or consumer-grade hardware. Port mirroring, for example, is rarely supported by consumer-grade equipment.
2. What hardware vendor(s) do you have?
Some of the most useful protocols, such as NetFlow, aren't supported by all vendors. So, your ability to monitor bandwidth based on flows is limited to those vendors and models that support flow protocols.
i NetFlow is a protocol for collecting, aggregating and recording traffic flow data in a network. NetFlow data provide a more granular view of how bandwidth and network traffic are being used than other monitoring solutions, such as SNMP. NetFlow was developed by Cisco and is embedded in Cisco's IOS software on the company's routers and switches and has been supported on almost all Cisco devices since the 11.1 train of Cisco IOS Software. Read more ...
3. How much management access do you have?
You need administrative access to the router or switch to enable SNMP or to mirror traffic to an additional port. In a corporate environment, the network administrators will have full access to their own equipment, but only limited access to provider equipment. In a home environment, most customers will have no management access to their Internet Service Provider (ISP) router. If you don't have management access to the equipment, your options for monitoring are limited, and you may need to rely on reporting from the ISP.
4. How many free ports do you have?
Port mirroring (for sniffing) requires an unused port on your switch. If you're already actively using all the ports, you'll need to disconnect something first (not an ideal plan), or you won't be able to mirror traffic to a sniffer.
So, let's look at the steps in detail:
6 Methods to Identify and Stop Bandwidth Hogging
Method 1: Check Router and Switch Statistics for Bandwidth Hogs
If your hardware supports it, one of the first places to look is at the device itself. Many devices include detailed traffic statistics as part of their user interface. If you're lucky, your device will report which ports have the most bandwidth usage on them, and what IP addresses or protocols are causing this traffic.
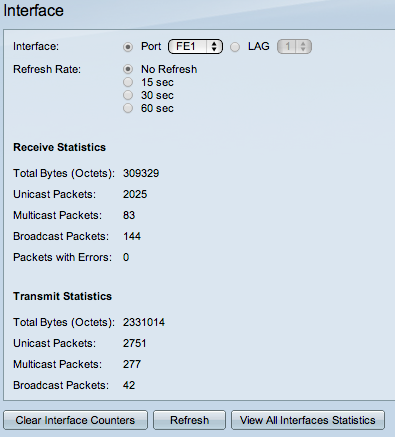
Example: Cisco SF/SG 200 & 300 Series
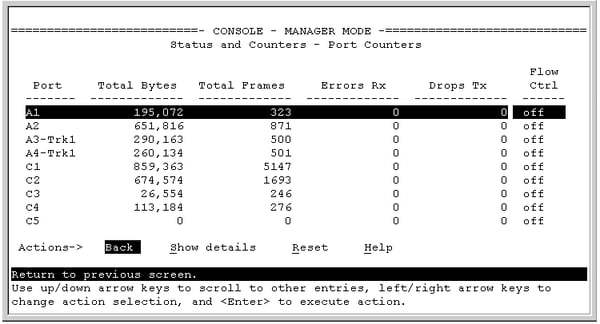
Example: HP 2920 Series Port Counters
This requires that you have enough management access to the router to be able to view the statistics, and that the router provides these statistics. If you don't have management access, you can try asking your ISP to generate a report for you.
Method 2: Use SNMP to Monitor Bandwidth Hogging Activity
The next line of attack is SNMP, the Simple Network Management Protocol. There are standard SNMP metrics to measure the amount of traffic in/out on each port. These traffic details are included in the "IF_MIB" (Interfaces MIB), which is supported by all major hardware vendors and operating systems.
To use SNMP, you must first enable SNMP on your router/switch. The steps to do this vary from vendor to vendor, so please check the documentation from your vendor. Pay attention to two important factors as you're configuring SNMP: what version of SNMP the device supports (v1, v2 or v3), and the read community string, which is like a password for SNMP.
To test that your device is responding to SNMP, you can use Paessler's free SNMP Tester for Windows.
Once the switch is responding to SNMP, you need a monitoring tool to query your device using SNMP. There are SNMP-based monitoring tools available at all price levels, from freeware to large enterprise platforms. Paessler PRTG, for example, is a unified monitoring tool, including SNMP monitoring, which can be run as freeware in a SOHO environment or with a commercial license for corporate environments.
Bandwidth monitoring with SNMP will tell you the amount of traffic, over time, on each port. If certain ports have spikes of traffic, you know that the devices connected to those ports are generating a lot of traffic.
As an example, here's a screenshot of an SNMP traffic sensor from PRTG, showing the amount of traffic in/out, and some additional details about the type of traffic, such as unicast versus broadcasts.
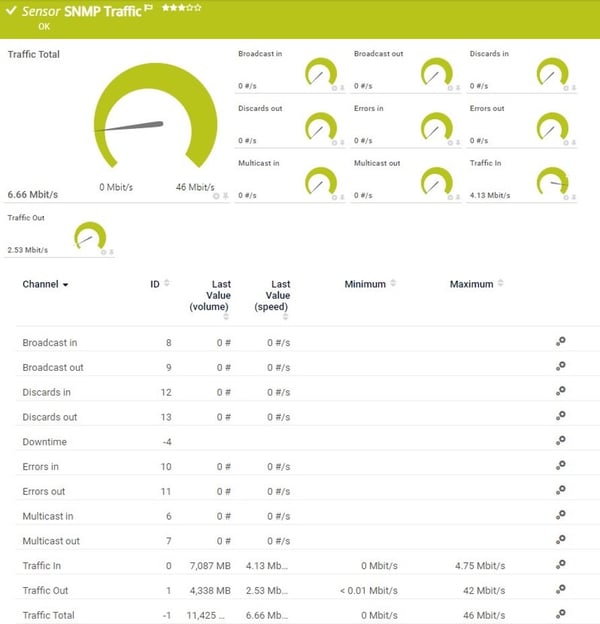
Example: PRTG SNMP Traffic Sensor
The additional information, such as the number of broadcasts, can be very useful when debugging network problems. A high number of broadcasts, for example, can indicate spanning tree problems. If your spanning tree is constantly recalculating, you will have recurring network problems. What you think is somebody hogging the network could actually be underlying protocol problems, so don't ignore these additional counters.
i Key Takeaway: SNMP monitoring shows you which ports have bandwidth hogging activity. It's the easiest method to implement and works with virtually all network equipment. PRTG's SNMP Traffic sensors provide continuous monitoring with minimal network performance impact.
Method 3: RMON for Advanced Bandwidth Analysis
It's gone a bit out of fashion, but RMON (Remote MONitoring) is a useful extension to SNMP that you can also consider. If your vendor supports it, RMON adds additional details about the type of traffic you've got. It was originally developed for monitoring remote sites (hence the name), but can monitor LAN and WAN equipment as well. Since RMON is an extension to SNMP, you need to have SNMP enabled, and your device needs to support the RMON MIB files.
In addition to the SNMP traffic statistics shown above, RMON includes the number of drops, collisions, CRC errors, oversized packets, and much more. This doesn't tell you who's hogging your bandwidth, at least not directly. However, problems here (eg. a lot of CRC errors) tell you that you have underlying network problems, so the issue you're trying to track down might be the network rather than a user.
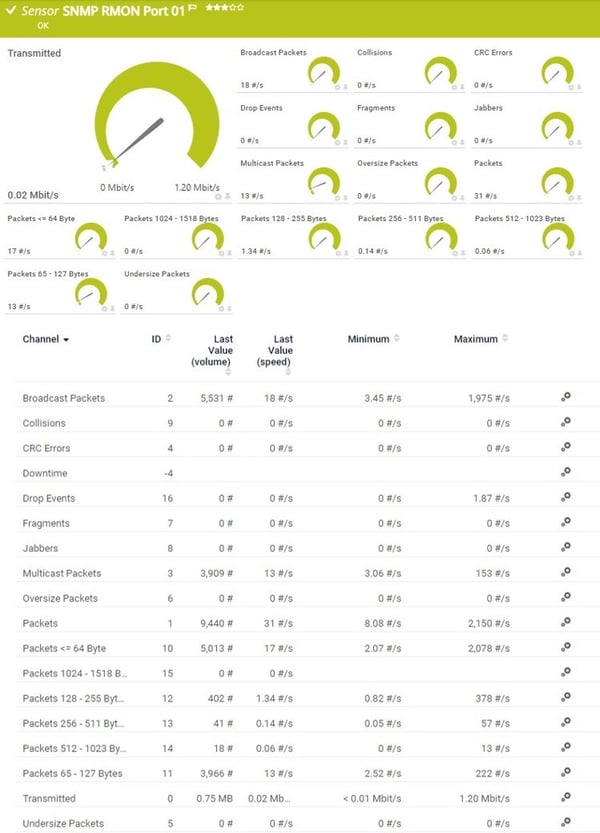
Example: PRTG SNMP RMON Sensor
But let's go back to looking for the cause of a bandwidth spike...
At this point, we know from SNMP how much traffic is flowing through a port, and we can see which ports have a lot of traffic on them. If we're lucky, there is only one device attached to a port, and then we know which device is causing all the traffic.
However, there could easily be multiple devices behind that port, and knowing the total traffic from all those devices doesn't tell us which one device is the culprit. To see that, we need to dig deeper into the content of the traffic, and we do that using "flows".
Method 4: Flow Protocols to Pinpoint Bandwidth Hogs
The flow protocols are a family of protocols that have one thing in common: they keep track of traffic flowing through the switch and they analyze the data to record things like source/destination IP addresses, source/destination MAC addresses, class of service, IP protocol used, etc.
The flow protocols include:
- NetFlow (Cisco proprietary)
- sFlow ("Sampled Flow", an industry standard for flow, supported by multiple hardware vendors)
- jFlow (Juniper Flow)
- IPFIX (Internet Protocol Flow Information Export - a standardized version of flow from the IETF)
- Flexible NetFlow (Cisco proprietary)
- NetFlow Lite (Cisco proprietary)
A "flow" is like a conversation between two devices. Flow-enabled routers keep track of each packet they see, and create a flow record for each flow that they see. The flows are identified by the source IP, destination IP, source port, destination port, and IP protocol. So, all packets flowing between, say, 10.10.10.10:80 and 10.200.200.200:51072, make up the one flow between those two machines.
Flow-enabled routers can send information about the flows they see to a flow collector device. The flow collector receives information about the flows from multiple devices, and can then create reports about the flows.
PRTG, for example, includes flow collectors for NetFlow v5, NetFlow v9, sFlow, jFlow and IPFIX. It then determines "top lists" from the flows:
- Top Talkers - The servers or PCs that are generating the most traffic in your network
- Top Connections - The top connections that are using the most bandwidth in your network
- Top Protocols - The top TCP and UDP protocols that are using the most bandwidth in your network
- And custom top lists
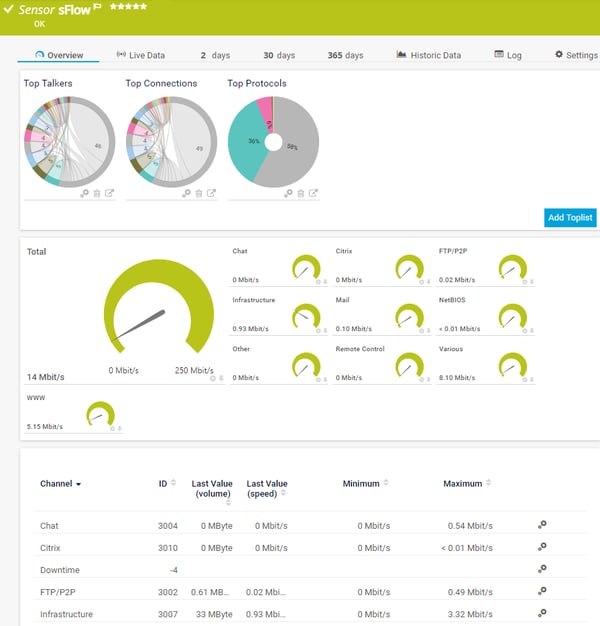
Example: PRTG sFlow Sensor
And now you can see the real power of flow monitoring: the top lists tell you exactly who or what is using the most bandwidth. You've found the culprit!
i Key Takeaway: Flow protocols (NetFlow, sFlow, IPFIX) are the most powerful tool for identifying specific bandwidth hogs. They reveal exactly which devices, users, and applications are consuming bandwidth. PRTG supports all major flow protocols and provides real-time visibility into bandwidth consumption.
Um, but why is there still more writing below? We should be done now, shouldn't we?
Well, that depends...
Unfortunately, lots of devices don't support flow, especially lower-end equipment. Or, your device might support it, but you don't have management access to the device to be able to enable flow monitoring. What then?
Method 5: Packet Sniffing to Detect Bandwidth Hogging
At this point, the only option left is traffic sniffing. That means using some additional device, such as your laptop, to sniff packets and analyze the results.
The best way to sniff traffic is to configure your router to "mirror" or "span" all of the traffic it sees to an unused port. And then you attach your sniffer device (e.g. your laptop) to that mirror/span port. However, this requires administrative access to the router to configure it to start mirroring/spanning.
(An aside: what's the difference between "mirroring" and "spanning"? None. Cisco calls their mirroring function "SPAN (Switched Port ANalyzer)", which is why the two terms have become interchangeable.)
If you're able to configure the router to mirror traffic, then you can attach a laptop to that port, and then use sniffing software to analyze the traffic. If you can't configure the router to mirror, then look for some other device where you do have access, that's close to the target router (from a network point of view), and sniff on it instead. The results won't be perfect, but might still be enough to show you what's going on in the network.
You now need some kind of sniffer software. If you'd like to see top lists, similar to NetFlow, then you can use the PRTG "packet sniffer" sensor to analyze the traffic and produce top lists similar to those you get from NetFlow.
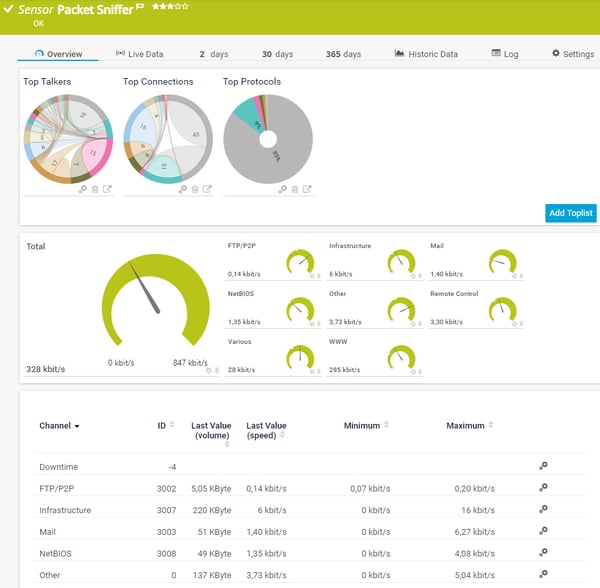
Example: PRTG Packet Sniffer Sensor
If you need more than just top lists, then Wireshark is THE gold standard for traffic sniffing. It's not the easiest to learn, but it's extremely powerful once you've got the hang of it. Wireshark offers multiple ways to track down bandwidth hogs, for example, under Statistics | Endpoints | IP and then sort the columns to identify the top talkers.
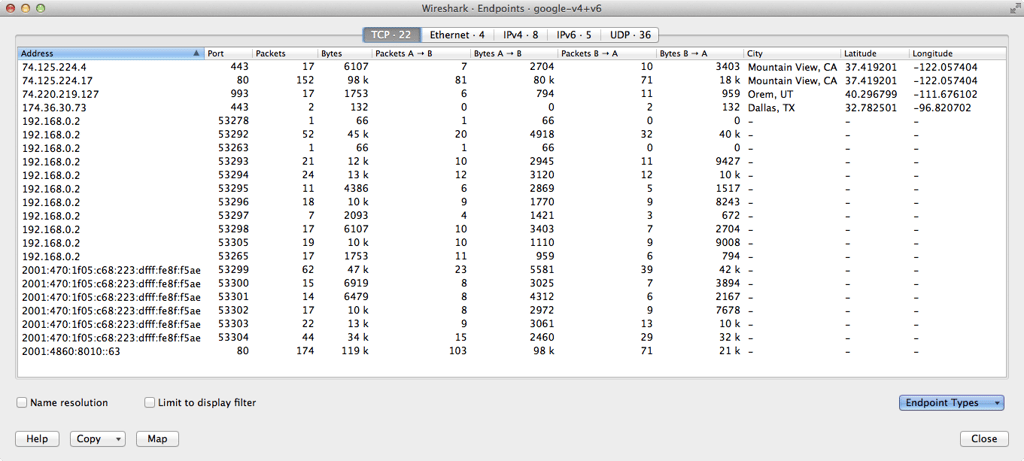
Example: Wireshark Endpoints
i Key Takeaway: Packet sniffing provides the deepest analysis but has high CPU overhead. Use it only when flow protocols aren't available or for detailed troubleshooting. PRTG recommends packet sniffing only for connections under 50 Mbps.
Method 6: Network Taps and Packet Brokers for Enterprise Bandwidth Monitoring
If none of the above has helped, your last line of defense is taps in combination with a packet broker. Taps are physical devices that are installed in-line in your network. Because they're in-line, they see all of your traffic and send copies of the traffic to a central network monitoring device. The monitoring device, called a packet broker, collects the traffic from all of your taps and forwards it to network monitoring tools for analysis.

How Network Taps Work
Taps and packet brokers are usually too expensive for an SMB to consider. However, consulting companies often offer network analysis based on taps/brokers as a service. So, if you really, really need to track down a problem, and the steps above haven't helped, you can hire someone to temporarily tap the network for you. Installing taps involves temporary interruptions in the network, so this isn't something you want to do often.
Comparison: Which Method Should You Use to Find Bandwidth Hogs?
| Method | Best For | Bandwidth Hog Visibility | Difficulty | PRTG Support |
|---|---|---|---|---|
| Router Statistics | Quick checks, immediate troubleshooting | Port-level only | Easy | Via SNMP |
| SNMP | Continuous monitoring, all network sizes | Interface/port level | Easy | ✓ Native sensors |
| RMON | Detailed error analysis, remote sites | Port-level + errors | Medium | ✓ Compatible |
| Flow Protocols | Identifying specific devices/apps | Device, user, application level | Medium | ✓ All protocols |
| Packet Sniffing | Deep analysis, low-traffic lines | Complete packet visibility | Hard | ✓ Packet Sniffer sensors |
| Taps/Brokers | Enterprise-wide visibility | Complete network visibility | Very Hard | ✓ Via packet analysis |
Recommended Approach:
-
Start with SNMP for baseline bandwidth monitoring across all interfaces
-
Add flow monitoring for detailed bandwidth hog identification
-
Use packet sniffing only for targeted troubleshooting of specific issues
-
Consider taps/brokers only for enterprise environments with complex requirements

Steps for Tracking Down Bandwidth Hogs
Summary: Stop Bandwidth Hogging in Your Network
We've now seen all the steps and possible solutions, from easiest to most difficult, that you can use to track down bandwidth hogs in your network and to ensure efficient working of your hardware, routers, and fast internet for everyone.
Common bandwidth hogs in business environments include:
-
Video conferencing platforms like Zoom and Microsoft Teams
-
Cloud backup and synchronization services
-
Large file transfers and database replication
-
Video calls across multiple departments
-
Unauthorized apps or services running on the network
-
Malware or compromised devices generating excessive traffic
-
Software updates downloading across multiple workstations
Understanding what's consuming your network bandwidth helps you optimize network performance, implement QoS (Quality of Service) policies, and ensure fair bandwidth distribution across all users and devices. Whether you're managing a corporate network with Ethernet connections or troubleshooting Wi-Fi issues across your organization, these methods work across different operating systems including Windows, Linux, and macOS.
Steps for Tracking Down Bandwidth Hogs
Ready to start monitoring your network for bandwidth hogs? Download PRTG's free trial and get complete visibility into your network traffic within minutes. The trial includes all sensors mentioned in this guide—SNMP, flow protocols, and packet sniffing—so you can choose the method that works best for your infrastructure. PRTG provides real-time notifications when bandwidth consumption exceeds thresholds, helping you maintain optimal network performance and internet speed.
With PRTG's comprehensive network monitoring capabilities, you can monitor data usage across your entire infrastructure, identify applications and devices consuming the most bandwidth, and take action before slowdowns impact your users. The platform integrates seamlessly with your existing firewall and network infrastructure, providing a complete view of your network traffic and bandwidth usage patterns.
Did you find our guide helpful? How do you find bandwidth hogs? Leave us a comment in the section below.
 Published by