 Published by Sascha Neumeier
Last updated on September 26, 2025
•
28 minute read
Your IT infrastructure is the core of your business. Infrastructure monitoring is your insurance policy protecting your technology investments against exorbitant failure costs and downtime.

In this article, you'll learn to build an efficient IT infrastructure monitoring strategy in 4 steps. With the right monitoring strategy you will learn how to optimize your monitoring concept, reduce operating costs and provide better service to your customers, whether you are monitoring 50 network devices or 5,000+.
📋 WHAT YOU'LL LEARN
At the end of this article, you will have learned all about these fundamental IT infrastructure monitoring principles:
✅ Step 1: How to define monitoring points, set intelligent thresholds and configure notification options that allow you to avoid false positive
✅ Step 2: Network segmentation strategies for SOHO environments to enterprise installations with over 10,000 infrastructure components
✅ Step 3: Building out centralized dashboards with real-time visibility into your infrastructure for both technical and business stakeholders
✅ Step 4: Setting up response teams and notification systems to eliminate downtime and speed up issue remediation times
💡 Bonus: Learn how PRTG Enterprise Monitor's unlimited sensor and subscription-based licensing can help you transform your monitoring solution at lower cost of ownership.
By getting your IT infrastructure monitoring right, organizations can see 99.9% uptime while lowering operation costs by as much as 25%. Whether you are monitoring 50 devices or 5,000+, using an ordered monitoring strategy is a key principle in keeping business operations continuous and avoiding catastrophic outages. For larger, enterprise environments, it's critical to use a tool with monitoring capabilities like Paessler PRTG Enterprise Monitor to monitor your entire distributed infrastructure at scale.
Step 1: Define IT Infrastructure Monitoring Points, Thresholds, and Alerts
Before setting up your IT infrastructure monitoring architecture, you need to understand your environment in detail. This is the starting point of any working infrastructure monitoring works.

For each item you want to monitor, there will be several points where you can measure your values. If you want to monitor devices themselves, you may need to check device temperature, fan speed, disk space remaining, CPU usage, memory usage, or other metrics that might be relevant for the successful operation of that device.
As you can see, the more monitoring metrics you will add, the more processing power and planning you will need for your monitoring concept.
Define thresholds
To make each point of measurement meaningful, you need to define thresholds. So not only do you need to know what you want to measure, but also define an acceptable range of operation for each component you are monitoring.
Examples of thresholds are: a device should not exceed a specific temperature, available storage should not get below 10%, and so on. When a threshold is breached, an alert is fired, and the relevant IT teams are notified.
Examples of thresholds: a device shouldn't get hotter than a specific temperature, available storage should not get below 10%, and so on. When thresholds are exceeded, an alert is triggered, and the relevant teams notified.
Advanced Threshold Management with PRTG Enterprise Monitor
Enterprise class IT infrastructure monitoring needs more advanced threshold management capabilities. Paessler PRTG Enterprise Monitor offers dynamic thresholds that automatically adjust based on historical data trends, reducing alert fatigue by up to 60%. The monitoring platform supports multiple threshold types, including:
- Conditional alerts for complex multi-parameter scenarios
- Threshold alerts with custom warning and error levels
- Limit alerts for absolute value monitoring
- Status alerts for device availability monitoring
This intelligent approach to threshold management ensures your IT infrastructure monitoring system is not bogged down with unnecessary alerts and that your monitoring system scales efficiently across thousands of sensors, without overwhelming your operations team.
Automated Discovery and Asset Management
Unlike lightweight infrastructure monitoring tools, a holistic IT infrastructure monitoring platform should include automated discovery and configuration management features. This is important, as new devices and services are added to your network, it is important these get automatically discovered and monitored, instead of resulting in blind spots which may lead to unplanned outages.
Step 2: Implement Network Segmentation for Scalable IT Infrastructure Monitoring
For very large IT infrastructure monitoring deployments, it quickly becomes infeasible to have thousands of polling engines inside your network. This is when network segmentation becomes important.
The network segmentation monitoring architecture may look something like this:
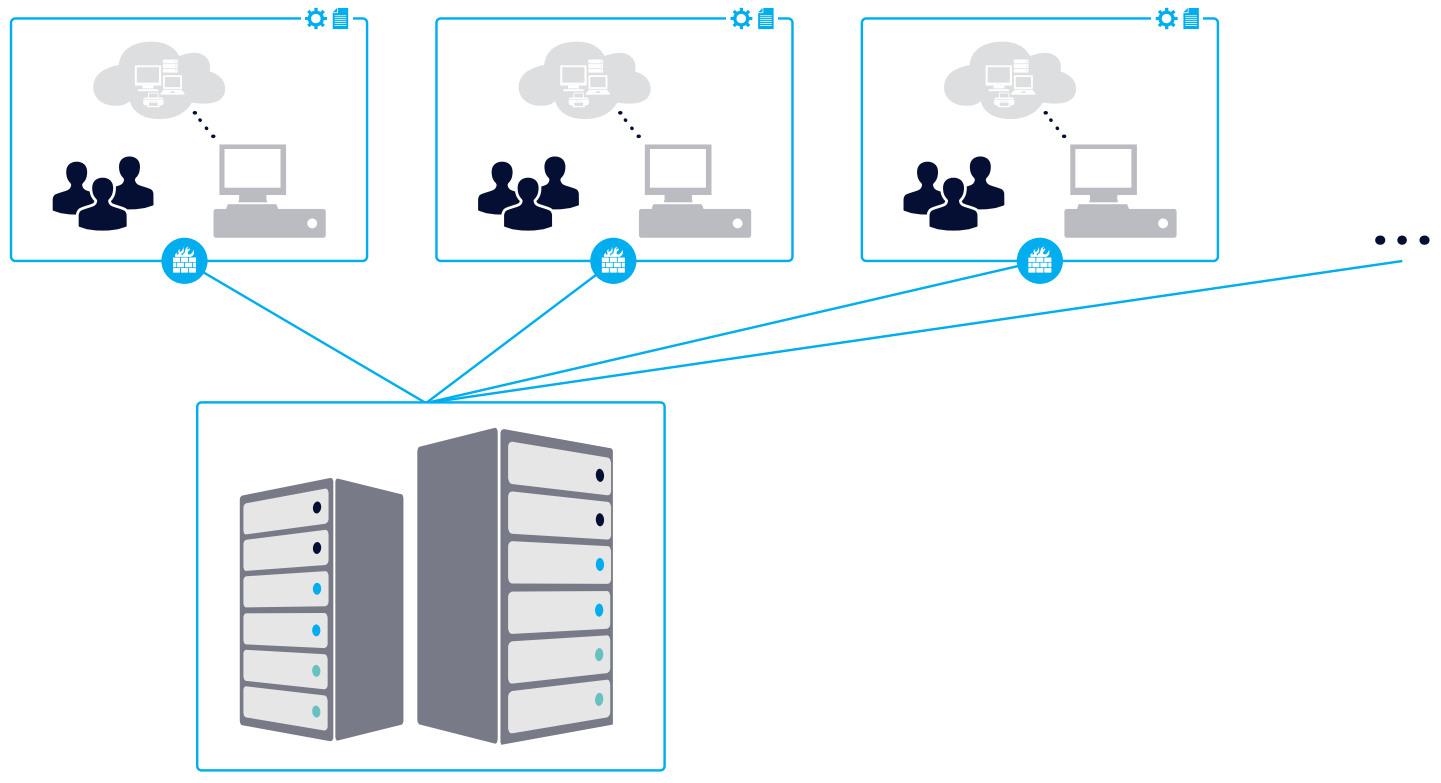
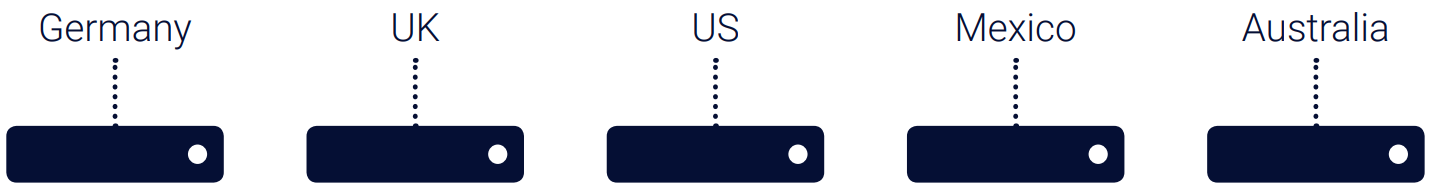
Where, in each part of your network is monitored separately, and the monitoring information sent to the central monitoring system. How to segment your IT infrastructure will vary with your specific environment. One way is to do the monitoring by region:
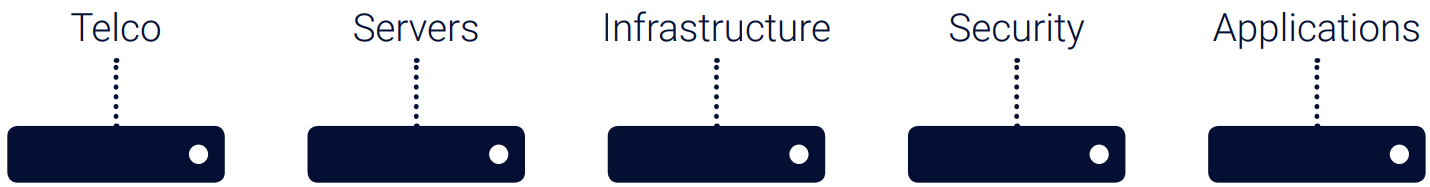
Another way is to segment the monitoring by function. For example, in one instance, you are monitoring the servers, while in another instance, you are monitoring applications:
Remember, these are just examples to give you an idea of how you should think about the monitoring architecture. For your specific case, you might need the help and support of a certified integrator.
Enterprise-Scale IT Infrastructure Monitoring with PRTG Enterprise Monitor
PRTG Enterprise Monitor solves the challenge of enterprise-scale IT infrastructure monitoring through a subscription-based licensing model that eliminates the traditional sensor limit. Designed for the enterprise, Paessler PRTG Enterprise Monitor offers unlimited monitoring capacity and advanced support for distributed monitoring architectures. The high performance built-in database system far outperforms traditional SQL servers for data collection and retrieval, ensuring maximum performance metrics even when monitoring thousands of infrastructure components across multiple locations.
Unlike the standard PRTG Network Monitor, the Enterprise Monitor edition delivers:
- Unlimited sensors to monitor your entire infrastructure
- Subscription-based OpEx model instead of CapEx licensing
- Advanced distributed monitoring spanning multiple geographies
- High-performance database and optimization for enterprise workloads
- Enhanced scalability that supports 10,000+ monitored devices per installation
This enterprise-class approach to IT infrastructure monitoring ensures your monitoring solution scales with your business needs while not bogging down under the weight of complex, distributed installations.
Step 3: Create Centralized IT Infrastructure Monitoring Dashboards
Irrespective of how you set up your monitoring, your IT infrastructure monitoring deployment will most likely involve multiple servers that collect information from multiple segments of your IT infrastructure. Consolidating this distributed monitoring data is key to effective monitoring management.
Now you need to put it all together so it can help you manage your entire IT, all from one central place. The best way to do this is to create dashboards with an overview of the infrastructure so that you can tell right away if there are potential issues.
Depending on how you segment your network, you may be managing everything from one central location, and in that case, one central dashboard that provides an overall summary makes sense. Or you may have multiple sites that are administered separately, and in that case, it would make more sense for each site to have its own dashboards.
Get an overview of IT services
A centralized view should be very high level. But what does this mean? Again, it depends on how you segment your network, but a good way to do this is to map components of your infrastructure to IT services. For example: your company's E-mail service, your licensing system or your software build processes are all IT services provided by several connected bits of hardware and connectivity.
Once you've defined your IT services, you can map the relevant parts of the IT infrastructure to them. E-mail service is an easy one: the mail server, the storage servers and the internet connection are the components of your network and infrastructure that you map to the "E-mail service" IT service. On your centralized dashboard, you would only see the health of the E-mail service.

If something minor happens – like a redundant mail server has performance issues – the email service itself would not be at risk as there are other mail servers that will do the job while this redundant mail server is being fixed. A notification will be sent to a team member, but it wouldn't result in an alert to the whole team – and on the centralized dashboard, the service would be green.
However, if there was a service-critical issue, let's say the core switch which all the mail data passes through has crashed – then the dashboard will raise an alert to the whole team and the E-mail service will be red on the centralized dashboard. At this point you can drill down to the underlying components to see which part of the infrastructure is broken, and start isolating the root cause.
Real-Time IT Infrastructure Monitoring Dashboards
Modern infrastructure monitoring requires more than basic status boards. A good IT infrastructure monitoring dashboard should provide:
- Service-level visibility that maps infrastructure components to business services
- Predictive analytics showing capacity planning trends and potential bottlenecks
- Multi-layered views from high-level executive summaries to detailed technical metrics
- Mobile accessibility to access infrastructure monitoring from anywhere
- Customizable widgets that are specifically targeted to different stakeholders
PRTG Enterprise Monitor includes advanced dashboard capabilities with real-time data visualization to help organizations maintain comprehensive observability across their entire IT infrastructure monitoring ecosystem.
SLA Monitoring and reporting
Arranging your infrastructure as business services not only makes it easy to get an overview, but also makes it easier to manage service level agreements (SLAs).
Large enterprises often have a lot of SLAs in place. There are internal SLAs that your IT teams have agreed upon to make sure certain requirements are met. Then there are external or customer-facing SLAs for companies that offer services to external clients. For example: you may have an uptime agreement for a certain service; in that case, you will constantly need to check connectivity to that service and raise an alert when it is unavailable. Or you have an agreement that a certain amount of bandwidth should be available, and in that case, you need to constantly measure available network traffic and raise an alert when it becomes too low.
Structuring your business services according to the SLAs you have to keep track of will give you a much better overview of the status of the services you provide and – if something goes wrong – let you drill down and find the root cause of the problem so you can fix it before you break your SLAs.
Predictive Analytics and Capacity Planning
Advanced IT infrastructure monitoring should go beyond reactive alerting to predictive monitoring. By analyzing historical performance metrics trends, organizations can be more proactive when it comes to capacity planning and performance degradation, and implement measures to avoid having it impact business operations.
Step 4: Establish Response Teams and IT Infrastructure Monitoring Notifications
In order to manage large IT infrastructure, an IT department is often divided into areas of competency, so you have different teams for different functions. For example, one team may be responsible for the online storefront, another team for the E-mail services and so on. Those teams, of course, will be responsible for monitoring their respective areas as well.
For your monitoring concept, you will have to define the user groups according to what areas they focus on. Then you define notifications for failures in those areas to go to the specific IT teams that need to know.
Paessler PRTG Enterprise Monitor: up to the big challenge
Paessler PRTG Enterprise Monitor Paessler PRTG Enterprise Monitor is a scalable infrastructure monitoring solution that can monitor large IT infrastructure. It keeps monitoring simple, and it has everything included – no need to purchase additional add-ons or modules. It is based on a subscription license model.
Which means that the focus here is on OpEx instead of CapEx and that the tool can upscale or downscale according to your infrastructure requirements.
PRTG Enterprise Monitor helps you deal with the challenge of monitoring large networks:
- Vendor agnostic
- Support for all major protocols and monitoring technologies
- Horizontal scaling through unlimited server installations
- Centralized overview focused on IT services Advanced alerts management to reduce alert noise
- Detailed overview provided by PRTG Desktop and web interface
- Roles and rights system, individual dashboards for specific user groups
- Apps (iOS and Android) for maximum flexibility
- Integrations with other tools, like Plixer, etc. to correlate monitoring information and reduce alert noise
- APIs for pushing data to analysis tools and integrate with other monitoring and management tools
Here, my colleague Shaun walks you through the features and benefits of PRTG Enterprise Monitor in a straightforward video.
For more information on how our products address your challenges, simply get in touch. As large monitoring setups require planning, experience, and a lot of monitoring know-how, I recommend talking to one of our PRTG experts around the globe.
Ready to put in place enterprise grade IT infrastructure monitoring? Start your free trial of PRTG Network Monitor and get to work with unlimited scalability and advanced monitoring capabilities designed to monitor complex IT environments.
Integration with IT Service Management (ITSM)
IT infrastructure monitoring today must seamlessly integrate with existing ITSM workflows, including ticketing systems, change management processes, and incident response procedures. This will create a unified approach to IT operations management and tear down silos that have traditionally existed between DevOps and Operations teams.
Conclusion
As we have seen, effectively implementing IT infrastructure monitoring requires detailed planning and segmentation, centralized dashboards, and the right response teams and notifications in place. For those monitoring larger, enterprise-level networks, you need a tool that has the advanced monitoring capabilities to meet the challenge of such a complex and distributed environment. Paessler PRTG Enterprise Monitor gives you the required monitoring capabilities needed to efficiently monitor large and complex IT environments. Its subscription-based OpEx model and unlimited sensor capacity mean it's a perfect fit for growing businesses that need a monitoring solution that is ready to scale. PRTG Enterprise Monitor works equally well monitoring on-premise IT infrastructure and cloud infrastructure, AWS and hybrid environments.
Interested in more details? Get our guide!
We have prepared a guide to successful enterprise IT monitoring for you. In it, you will find a lot more information on how to successfully monitor large IT infrastructures. Just click here and download the guide.


