 Published by Beat Köck
Last updated on October 13, 2025
•
11 minute read
Your website is the face of your business. Good performance is essential as visitors expect a fast, good-looking, and easy-to-use service.
Selecting the right website performance metrics for your website is a challenge. You want updates about every potential issue, but a flood of warnings about minor problems can obscure critical issues. Alerts on every broken link or slight decrease in site speed are excessive.
What you monitor depends on your business goals and website. Here are 10 essential website KPIs every website owner should track to guarantee excellent user experience.
1. Uptime
Website uptime is without doubt the single most important KPI for your website. Most business models rely heavily on their online presence.
When your website goes down, revenue stops. Downtime creates immediate financial losses—customers can't buy, employees can't work, and your reputation suffers with every minute offline.
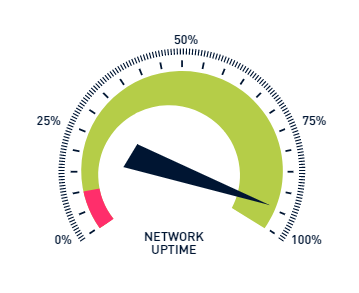
This is why successful businesses target 99.999% uptime—the "five nines" standard that allows for less than 5 minutes of downtime per year.
Since achieving near-100% uptime is critical, Paessler introduced World Uptime Day on April 10th, the 100th day of the year.
2. Time To First Byte (TTFB)
Your server's response speed determines whether visitors become customers.
When a visitor clicks your link, their browser sends a request to your server, which processes it and begins sending data back. The time between request and first data received is Time to First Byte (TTFB).
Why does this technical detail matter to your business? Because 40% of users abandon websites taking longer than 3 seconds to load. Slow TTFB means visitors leave before seeing your content, product pages, or services.
The three components affecting TTFB:
- Network delay sending the request
- Server processing time
- Network delay sending the response back
How to Monitor TTFB with PRTG: Our PRTG HTTP sensor provides precise TTFB measurements from multiple global locations, identifying bottlenecks before they impact user experience.
3. Full Page Load Time
Page loading speed isn't just a technical metric—it's a direct revenue driver.
Amazon found every 100 milliseconds of delay cost them 1% in revenue. Walmart saw conversion rates jump 2% for every second of improved load speed. Mozilla boosted conversions by 15.4% making pages load 2.2 seconds faster. (Source)
These aren't isolated cases. Google made page speed a direct search engine ranking factor, meaning slow sites get buried while fast sites rise. Core Web Vitals (Largest Contentful Paint, First Input Delay, Cumulative Layout Shift) are now critical SEO ranking factors affecting organic search visibility.
Full page load time includes everything: HTML, CSS, JavaScript, images, and videos. While ping tests and source code downloads give basic speed indicators, your visitors can't interact with your site until every element loads.
Optimization strategies and professional monitoring approach: Compress images, implement a content delivery network (CDN), enable caching, and minimize HTTP requests to improve website speed across all devices.
For comprehensive page load monitoring, use our PRTG HTTP Full Web Page sensor, to measure complete loading times including all page assets, providing real-world site performance data matching actual user experience.
4. Broken Links
Broken links signal poor maintenance to visitors of your business and could paint the picture that you don't pay attention to details.

When customers click a link and get a 404 error, they see a company that doesn't maintain its digital presence. This damages user satisfaction: frustrated visitors leave immediately, search engines downgrade your rankings, and potential sales disappear at critical conversion points.
Broken links break trust systematically. Google's algorithms interpret them as poor maintenance signs, hurting search engine rankings. Critically, broken links on product pages or checkout processes kill sales when customers are ready to complete the desired action.
Prevention strategy: Use tools like W3C Link Checker for automated scanning, and set up proper redirects when moving or deleting pages to maintain user experience and SEO value.
5. User Journey
Your most critical business processes happen through user workflows—and when they break, revenue stops.
Think about your website's key pages and critical paths: customers logging in to make purchases, prospects signing up for newsletters, users completing contact forms or registration. Each represents a business transaction requiring flawless functionality.
E-commerce sites are especially vulnerable. A broken checkout process doesn't just lose one sale—it loses customer trust and future purchases. Failed newsletter signups cost qualified leads showing genuine interest. Login problems prevent customers from accessing paid services.
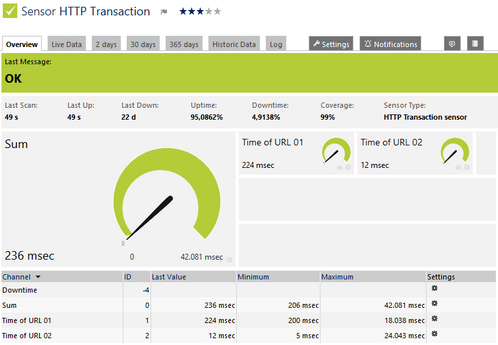
Monitoring solution: Our PRTG HTTP Transaction Sensor tests complete user workflows by executing up to 10 sequential steps, immediately alerting you when critical business processes fail so you can fix problems before they impact revenue.
6. Database Performance
Slow database queries create the kind of website delays that drive customers away.
Your database serves every dynamic element: product information, user accounts, content management, transaction processing. Slow queries cause unresponsive pages, incomplete product displays, or failed transactions.
The business impact compounds over time. Slow-loading product pages reduce conversion rates. Delayed authentication frustrates login processes. Sluggish content delivery makes your entire website feel unreliable, encouraging visitors to find alternatives.
Performance monitoring approach: Track database query response times to identify bottlenecks, monitor overall database performance to prevent system-wide slowdowns, and set alerts for error messages indicating serious problems.
7. Geographic Performance
Geographic performance differences can cost you customers without you ever knowing why. 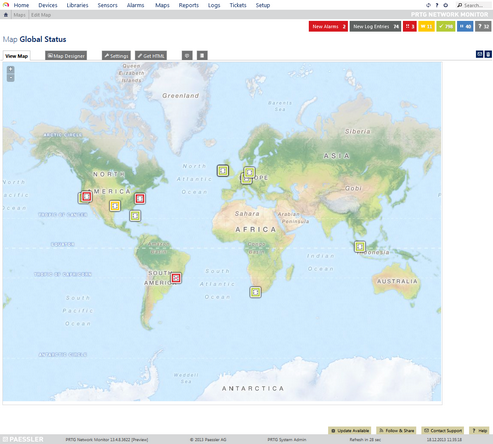
A customer in Tokyo might experience your website differently than someone in New York, despite identical content. Network latency, server location, and regional infrastructure create performance variations directly impacting user experience and conversion rates across markets.
Global businesses can't afford poor regional performance. If your website loads quickly for 90% of visitors but slowly in key international markets, you're excluding those markets. Analytics tools might show high bounce rates from certain countries, but without geographic monitoring, you won't understand the technical reasons behind lost international revenue.
Monitoring strategy: Use our PRTG Cloud Ping and PRTG Cloud HTTP sensors to test site performance from multiple global locations, ensuring consistent user experience regardless of customer location.
8. Your Web Servers' Hardware
Server hardware failures don't just create technical problems—they create business emergencies.
Your web server's hardware resources (disk space, CPU, memory) determine whether your website can handle customer demand. When disk space fills up, new orders can't process. CPU usage spikes slow page loading to unusable speeds. Low memory makes your entire website unstable.
These hardware bottlenecks often develop gradually, then cause sudden catastrophic failures. A slowly filling hard drive works fine for months, then suddenly prevents all new transactions. High CPU usage seems manageable until a traffic spike pushes it over, crashing your site during peak hours.
Proactive monitoring essentials: Track disk space usage to prevent data loss, monitor CPU utilization to identify performance bottlenecks before impacting users, and watch memory consumption to maintain stable operations under varying website traffic loads.
9. Website Visitors
Website visitor patterns reveal both business opportunities and infrastructure risks.
Website traffic data tells two critical stories: how well marketing campaigns attract customers, and whether infrastructure can handle demand. Steadily increasing unique visitors indicates growth—but warns servers might need upgrades. Sudden traffic drops signal technical problems driving customers away, or content quality issues needing immediate attention.
The real business risk comes from unpredictable traffic spikes. Social media mentions, viral content, or successful marketing efforts can flood your website. If infrastructure can't handle the surge, you'll lose potential customers when interest peaks.
Key metrics to track: Monitor total number of visitors, unique visitors, page views, session duration, average time on page, and number of pages per session to understand user engagement comprehensively.
Traffic management strategy: Use Google Analytics for visitor patterns and planning infrastructure needs, while running stress tests with monitoring tools like K6 to ensure servers handle unexpected surges without performance degradation.
10. Website Quality
Website quality directly determines whether visitors become customers or leave for competitors.
Quality isn't subjective—it's measurable through user behavior. Intuitive navigation keeps visitors engaged longer. Clear page purposes reduce bounce rates and improve goal completions. Well-structured content improves comprehension and conversion rates. Readable text and harmonious colors create positive user experiences building trust.
Google increasingly factors user experience into search rankings through PageSpeed Insights and Core Web Vitals, meaning poor website quality hurts both direct conversions and organic traffic. Spelling errors damage credibility. Outdated content suggests your business isn't reliable. Poor usability frustrates potential customers evaluating whether to trust you.
Quality audit framework: Regularly evaluate navigation intuitiveness, specific page purpose clarity, content structure effectiveness, visual design readability, call-to-action placement, copywriting appropriateness for your target audience, and information value. Monitor exit rates on key pages and landing pages to identify problem areas.
Protect Your Business with Holistic Monitoring
These 10 key performance indicators protect your business from technical problems that drive customers away and cost revenue.
Manual monitoring would consume all your time—time better spent growing your business. Successful companies use automated monitoring tools tracking all these website performance metrics continuously, alerting you only when action is needed.
Start with free professional tools: Paessler provides comprehensive free network and website monitoring tools developed from decades of enterprise monitoring expertise. These analytics platforms are professional-grade tools used by IT administrators worldwide to diagnose network issues, test site speed, and optimize infrastructure. Use dashboards to visualize performance data and benchmark against industry standards.
Take action today: Visit our free tools collection to access professional monitoring utilities complementing the performance indicators discussed in this article. Whether you need immediate website analysis or comprehensive network diagnostics, these tools provide the foundation for protecting your online business presence.
Your experience matters: What performance challenges has your website faced? Share your monitoring strategies and marketing initiatives in the comments—your insights help other business owners protect their online presence.


