 Published by Shaun Behrens
Last updated on April 20, 2022
•
7 minute read
The challenges with monitoring large IT environments are plentiful: often the infrastructure is distributed over multiple locations, you probably have hundreds or even thousands of devices to monitor, and you are usually dealing with multiple monitoring solutions and hardware manufacturers. Additionally, many devices provide their own dashboards, which means that you have more than one place to look when you are troubleshooting problems or performing diagnostics.

So how do you monitor all of this? Well, the principles of good monitoring are mostly the same for large environments as they are for small to medium-sized ones:
- get alerts and notifications when values reach defined thresholds,
- make sure you can view all of the information in one place, and
- specifically for larger environments, make sure your solution can scale according to your needs.
Paessler PRTG Enterprise Monitor is designed specifically for monitoring large IT infrastructure: it provides the possibility to scale the monitoring solution up to fit your environment, and delivers a powerful dashboard to get an overview of your infrastructure.
Scaling up
To monitor a large IT environment, it's important to be able to scale PRTG up. But first, let's consider the basics of monitoring with PRTG: the core principle is to have a PRTG server that monitors the infrastructure through various sensors. In PRTG lingo, a sensor is a mechanism used to get information about a device, application, or a service. Here's the definition from our knowledge base:
In PRTG "Sensors" are the basic monitoring elements. One sensor usually monitors one measured value in your network, e.g. the traffic of a switch port, the CPU load of a server, the free space of a disk drive.
On average you need about 5-10 sensors per server or one sensor per switch port.
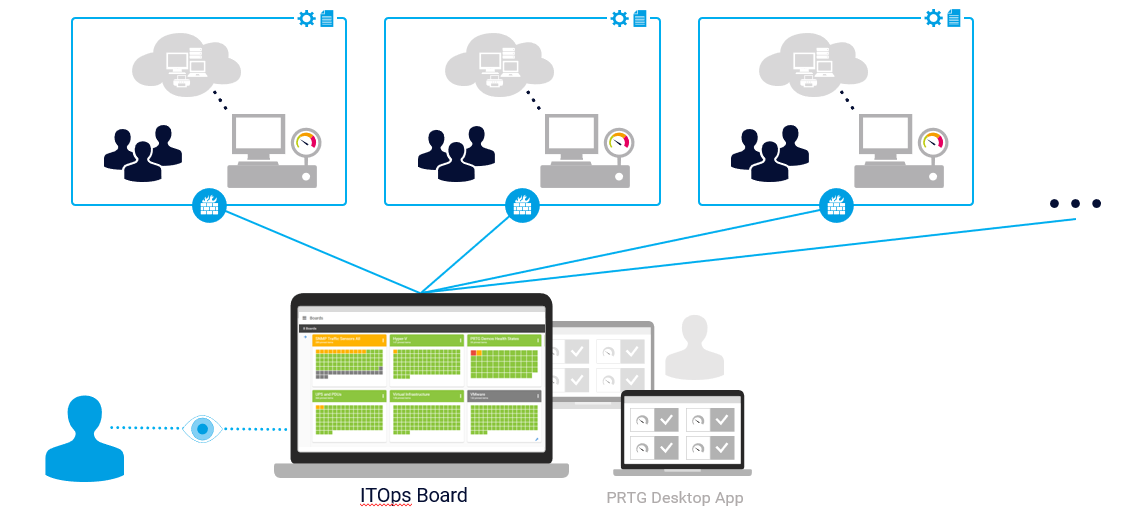
PRTG makes use of a central server monitoring devices and network infrastructure. In some cases, it makes sense to make use of remote probes, where a part of the environment is monitored and the details sent to a PRTG server. Then a unified view can be created (see the section below about the ITOps Board for more information)
Of course, this becomes a bit more complicated if you have a larger infrastructure. You might have to get smart about how you segment your environment—such as geographically, or by functionality—and then set up separate monitoring instances for each of those segments. I've discussed various methods of horizontal scaling in this article, so refer to it if you'd like an in-depth explanation of the various ways you can implement PRTG for your large scale needs.
Whichever approach you select, a larger environment might need several PRTG servers. PRTG Enterprise Monitor offers the ability to utilize unlimited PRTG servers, and comes with a flexible, annual subscription license. This ensures that PRTG can scale up easily if you find you need to implement more sensors – no need to switch licenses, or remember to renew your maintenance. This model promotes an OpEx-friendly approach over a CapEx one, since you can adjust your costs based on what you actually need.
But all that data coming from different devices is meaningless if you can't turn it into actionable information.

The PRTG ITOps Board: an overview of everything
The second way that PRTG Enterprise Monitor enables large scale monitoring is by providing flexible dashboarding. The ITOps Board (exclusive to PRTG Enterprise Monitor) enhances your setup with a service-oriented central overview across multiple PRTG servers.
One of the most important aspects of the ITOps Board is the concept of business services. Here’s more information about business services from the ITOps Board documentation:
“Business services provide a more structured presentation than boards. They organize data according to perspectives that show how the health and performance of components impacts different aspects of your business.”
You can define which services are critical to your business—think of your company’s Email service, a licensing system, or a software build process. With the PRTG ITOps Board, you can map the data that you monitor in your infrastructure to these business services. This will give you an overall status of their health and let you set alerts based on certain criteria. The end result is less alert noise, because you can get an alert when a specific business service is compromised. Then you can drill down and see exactly where the root cause of the issue is.
The ITOps Board also offers advanced reporting for Service Level Agreements.
Find out more about PRTG Enterprise Monitor
If you would like to find out more about how PRTG Enterprise Monitor can be used to monitor large scale infrastructure, then get in touch with us!