 Originally published on February 07, 2018 by Paessler Editorial Team
Last updated on March 03, 2022
•
6 minute read
In our daily lives, doctors will point to our dietary intake as a predictor of long-term health. The number one recommendation is to eat the right amount and types food. If we’re honest with ourselves, we’re probably not where our doctors want us to be. In the world of Business and Technology, these things remain true for our data consumption. So, where do we start? Simple; design a diet, stick to it, and watch for issues.
Design Your Diet
Each user, application, and service has its own unique data consumption requirements. Determining your thresholds is a simple process.
- Identify who and what is important to the business
- Track total consumption using SNMP
- Watch detailed bandwidth statistics by protocol using flows or packet sniffing
- Compare the results and take action
Let’s use the following example. First we have a discussion and review records to determine that we have one business service we need to monitor. That business service is comprised of two web servers and a file server. By adding SNMP monitoring at the gateway, we discover that there is, in total, an average 5 gigabits of data consumption for the entire location. We then add a second layer of SNMP monitoring at the two web servers and the file server. That lets us know the web servers are consuming an average of 0.5. gigabits each and the file server is consuming and average of 2 gigabits. We then add flow protocols or Packet sniffing at the gateway and see the expected 2 gigabits of file transfer, 3 gigabits of web traffic. We now know that our business consumption is approximately 3 gigabits of traffic and we have 2 gigabits of unidentified web traffic that needs to be addressed.

fig.1: Netflow v9 Sensor overview - exemplary
Sticking To Your Diet
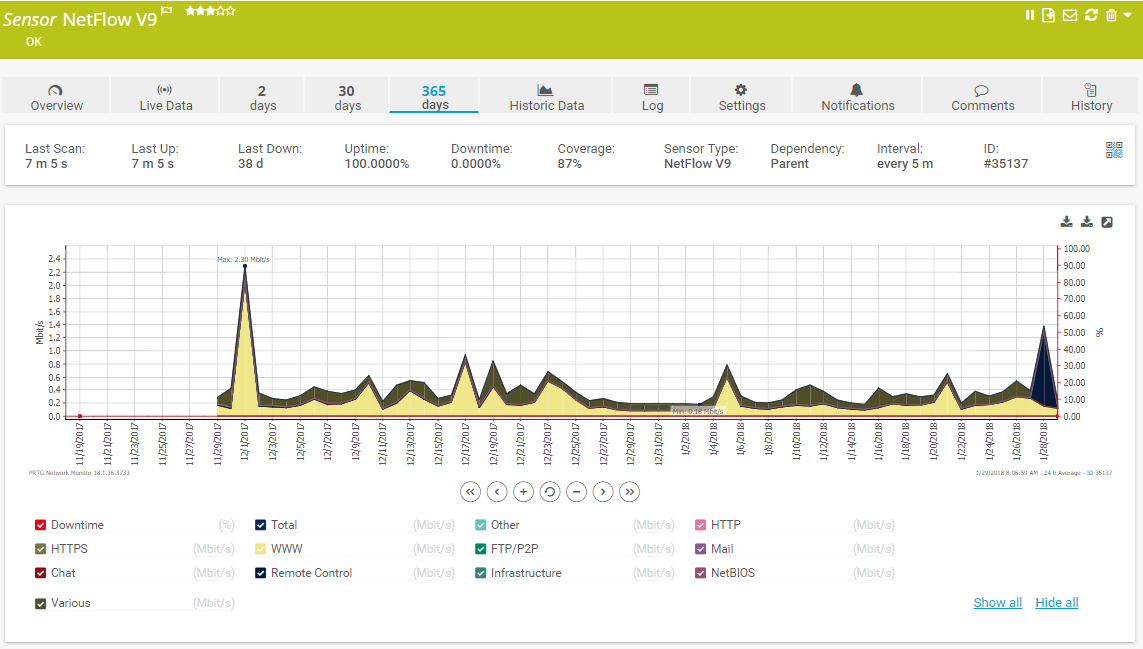
One of the most common things we encounter when watching data consumption is over utilization. It is easy for users, applications, and services to consume more data than expected if web traffic is unrestricted like in the example above. Fortunately, this is easy to spot in monitoring. It typically appears as a gradual but steady increase in data consumption over time; however, it can appear as a sudden spike in consumption if a new server or application comes online. A good place to start is setting channel limits and notifications for SNMP sensors. You can also watch the top talker, top connections, and top protocols list with to help identify and isolate the source.

fig.2: Netflow v9 Sensor 365 days view - exemplary
Watching For Issues
A sudden, unexpected, or sustained drop in bandwidth utilization can be a strong indicator of a potential significant issue. The important thing to understand is if you are returning to a healthy level or if you have lost connection to a vital data source. Having associated sensors such as PING, HTTP, database, or logs can help you quickly understand what is happening and what direction to focus support efforts.
Occasionally, you’ll find something in your diet that doesn’t agree with you. Using SNMP monitoring, you can quickly identify trouble spots in your network that are experiencing excessive errors and discards. This can be matched with database and application monitoring to quickly find the source of disagreement with your environment.