
 Originally published on November 12, 2021 by Shaun Behrens
Last updated on January 23, 2024
•
6 minute read
These days, REST APIs are just about everywhere. Everything from gateways and firewalls through to ticket systems and weather sites offer REST APIs that let you query information. This represents an opportunity to bring even more data into your monitoring concept. Think of examples like monitoring weather conditions using APIs of online weather sites, or the number of open tickets in your ticket system. To help you harness the flexibility that REST offers, Paessler PRTG provides you with the REST Custom Sensor V2 as part of its monitoring solution.
The REST Custom Sensor V2
With this sensor, you can query any REST API that returns JSON or XML, and then map the results into sensor channels. It’s a sensor that has been in PRTG for a few years now, but version 2 makes it far easier to set up and use than before.
i Before we continue, a note about this sensor: right now it’s what we refer to as a Beta sensor. This means that it’s tested and functional, but we’re still collecting feedback from users about it. If you’d like to try it out, you need to turn on experimental features in your PRTG installation. For more information, see the following Knowledge Base article: What are beta sensors and how can I use them?
So how does it work? Well, firstly you need to know the request URL of the API, which you can usually find in the documentation from the manufacturer or the Website, depending on your specific use case. Once you know this, and what you want to query, you can go about setting the sensor up in PRTG.
To demonstrate how to do it, we will monitor a Gitlab account as a specific example. We also have a tutorial video further down this post to show you exactly how this works in PRTG.
Querying Gitlab’s REST API with PRTG
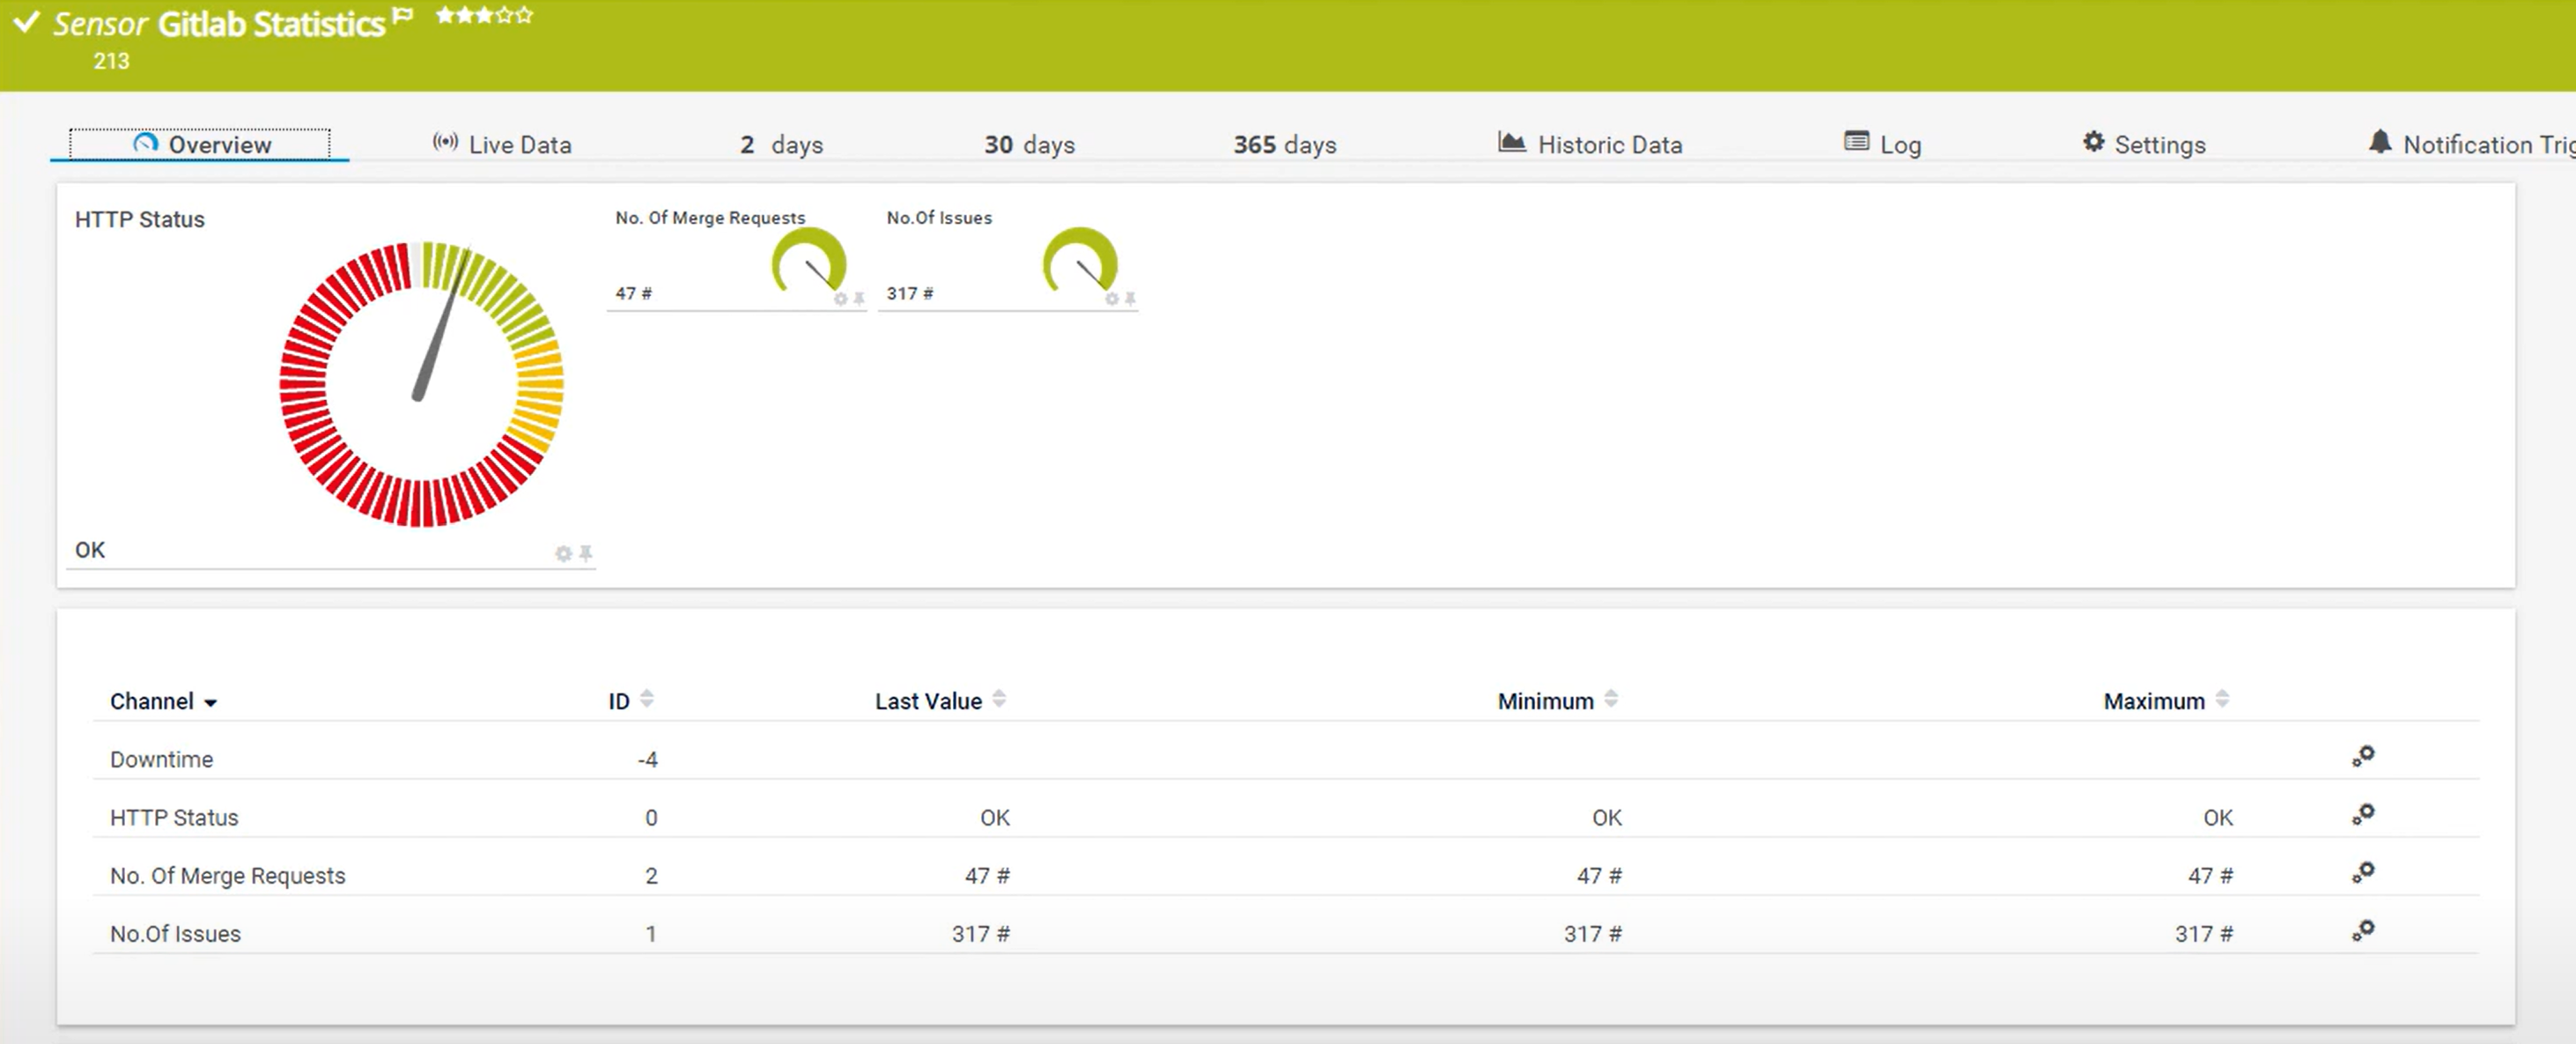
If you have a Gitlab account, you can use the Gitlab REST API to query information about the account. In our case, we want to monitor the number of issues and the number of merge requests. This information (and more) is available on the application statistics API page on Gitlab's website.
Souzana, a Product Owner here at Paessler, goes into each step in more detail in the tutorial below, but here are the main steps:
- Set up the Gitlab statistics as a device in the PRTG device tree (and add the relevant bearer token for authentication purposes)
- Add the REST Custom Sensor V2 to the Gitlab device in PRTG.
- Specify the channels and the specific statistics to show.
The resulting sensor looks like this:
For a detailed look at how to do it, watch the tutorial video.