 Originally published on July 02, 2018 by Sascha Neumeier
Last updated on April 20, 2022
•
9 minute read
Managing large-scale and multifaceted PRTG installations with tens of thousands of sensors in many locations across the globe requires administrators with deep knowledge and experience. Especially in such complex environments, a simple management of large systems is the holy grail for admins. Today we want to look at Savision's solution, which eases the management of very complex system environments - PLUS, register for our Savision Webinar on July 12th.
"Matthew Carr, Savision: We are a Netherlands based ISV with over 10 years’ experience of helping enterprises improve their monitoring of large complex environments. Our solution helps administrators focus on monitoring business services rather than just servers, by visualizing data in easy to understand dashboards. Savision is a proud member of the Paessler Uptime Alliance Partnership.
Scale Up Multiple PRTG Environments with Savision
Savision can help you with scaling up your monitoring environment with PRTG. With its big-data Elasticsearch database, Savision can easily handle multiple PRTG instances with tens of thousands of sensors.

By using Savision as your management layer for PRTG, you will see live status of your devices, groups, and services from a holistic point of view. When you see a problem, you can quickly drill-down into PRTG to perform root-cause analysis and triage.
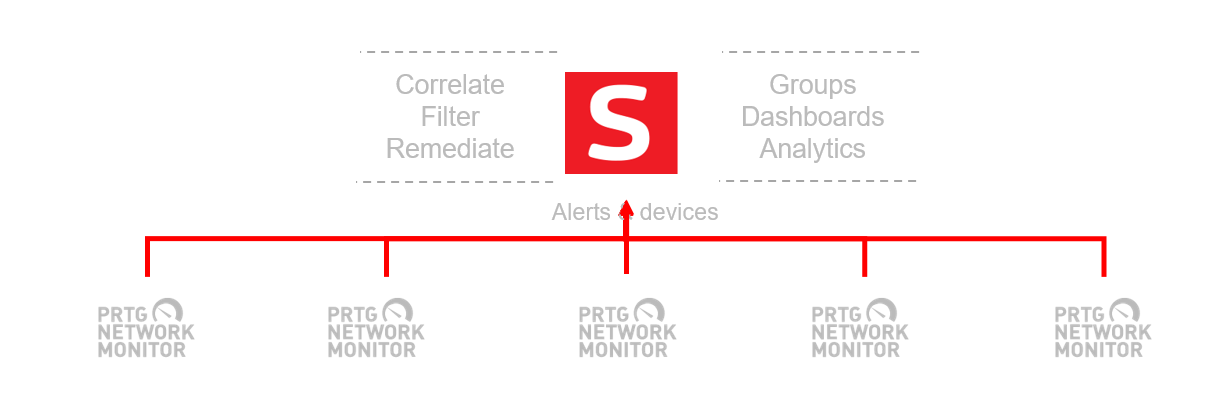
Connecting PRTG with Savision is a simple task for an administrator:
- Install Savision with Elasticsearch database on a server
- Add in credentials for each PRTG instance in the settings tab
- Configure refresh intervals for object discovery and Alerts/Health states
- Wait 10 minutes for the data to be fully populated
- Rinse and repeat for as many PRTG instances are you require
Monitor Clusters and High Availability Groups
PRTG monitors devices and groups of devices. The health roll up of a group is dependent on one child or parent status. In many cases, you want to be notified when this group state changes so that you can take action. But what about a high-availability cluster?
With a high-availability cluster there will typically be 2 or more failover servers. Perhaps you only want to be notified when a certain number of servers in the cluster have turned red, and there is a lack of redundancy in the environment. This is where Savision comes into play.
Savision can create alternative health states of groups of objects. Using simple natural language search you can add devices into a separate group or board. The whole health of this “board” can then be defined separately based upon:
| Worst of | This is the default setting. Basically once one device turns red the whole board will turn red |
| Best of | An optional setting. Only when all devices turn red will the board turn red |
| Percentage base | A calculation based on the percentage of devices on the board that have to turn red to change the state of the board |
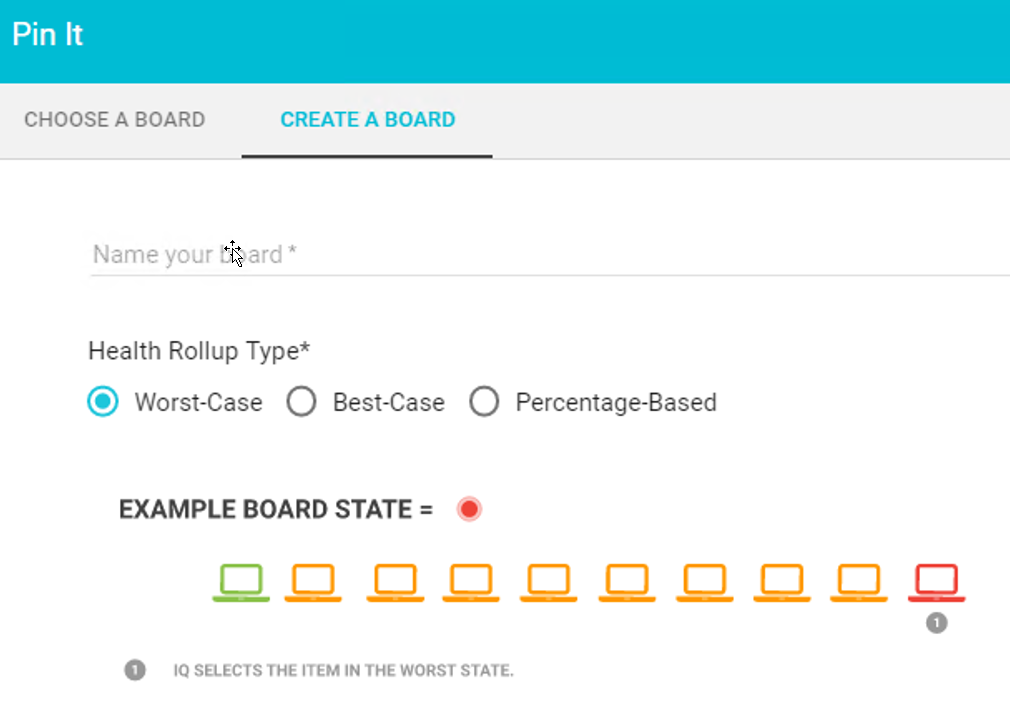
e.g. A board contains 4 devices with a 75% health roll up state. When the first 2 devices go red, the board does not change state. When the 3rd device turns red, this reaches the 75% threshold, and the board turns red, which can send off an alert to the administrator. This is a critical requirement now, because only one server in the cluster is still running with no further back-ups in the cluster.
Notifications such as Email and SMS can be sent when a board changes states (e.g. from Green to Red) so that you can take remedial action. Also, it is possible to set-off automation steps using our PowerShell integration to quickly resolve repetitive issues and keep your systems running.
Service Focused NOC Dashboards for Your Customers
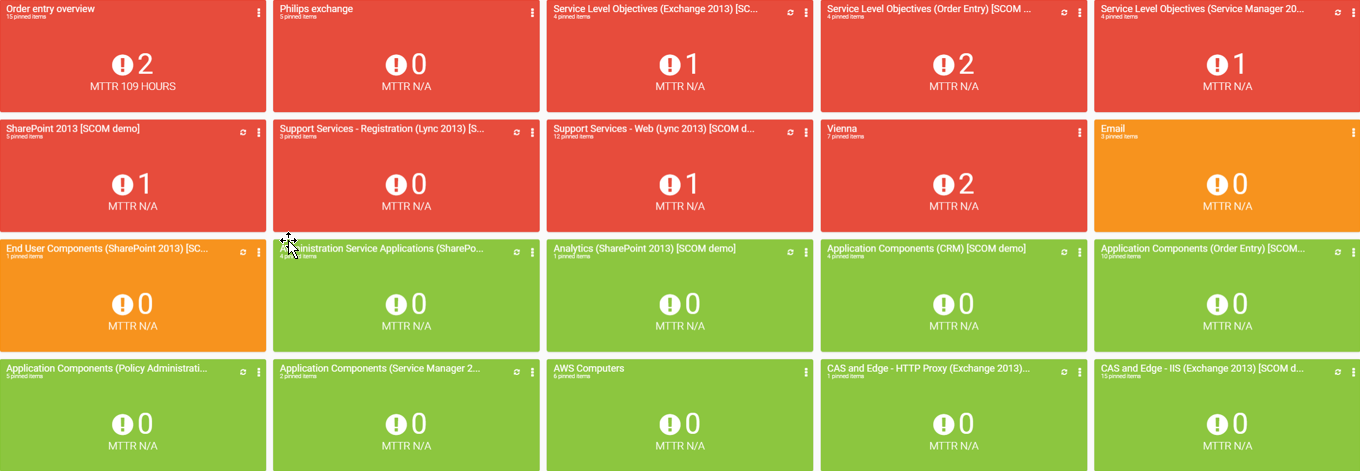
Once you have all your data in Savision, it is possible to quickly group your devices and objects into boards. These boards can represent business services, customers, or applications. After selecting the correct health-roll up that you like, the Master Overview shows all of your boards with the reds at the top.
This is a perfect view for a large NOC dashboards and allows administrators to quickly drill down and start a root-cause analysis. Once the critical device has been found, you can quickly dive into PRTG to analyze the issue further and perform resolution tasks.
Historical Alert Analysis
PRTG alarms shows the up or down status for sensors in real-time. Savision stores a history of all PRTG alarms in the form of open or closed alerts. This means you can always go back and analyze issues and see how they were resolved in the past. Also, it makes it possible to identify patterns and recurring issues in your network. You may discover that there is a large process running once per month that creates a recurring outage.
This is the type of insight that can only be found through historical analysis of your data. Savision can easily highlight those patterns so you can take remedial actions to provide more bandwidth at critical times.
Upcoming Webinar – Register Now for Free
If you would like to find out more about how Savision's intelligent solution simplifies the management of large PRTG installations, register for our upcoming webinar on July 12th where Paessler and Savision will demonstrate the combined solutions together.
If you have questions in advance about the webinar, feel free to contact us at any time by leaving a comment below or directly drop an email at Matthew Carr.